Layer of Protection Analysis (LOPA): IEC 61511 Engineering Guide
Perform semi-quantitative risk assessment using Layer of Protection Analysis methodology to determine required Safety Integrity Levels (SIL) for instrumented protective functions per IEC 61511.
Evaluate adequacy of safeguards for identified hazards.
Determine required SIL for Safety Instrumented Functions.
Validate IPL independence and effectiveness.
Comply with IEC 61511 or ANSI/ISA-84 requirements.
1. Overview & Applications
Layer of Protection Analysis (LOPA) is a semi-quantitative risk assessment methodology used to determine if sufficient protective layers exist to reduce risk to a tolerable level. It bridges qualitative hazard analysis (HAZOP) and quantitative risk assessment (QRA).
SIL selection
Safety Instrumented Systems
Determine required Safety Integrity Level (SIL 1, 2, or 3) for SIS design.
Gap analysis
Safeguard adequacy
Identify scenarios where additional protection layers are needed.
Regulatory compliance
IEC 61511, ISA-84
Meet functional safety standards for process industries.
Risk-based decisions
Cost-benefit analysis
Justify safety investments with quantitative risk reduction data.
Key Concepts
Initiating Event: Failure or deviation that starts accident sequence (e.g., pump seal leak, control valve fails open)
Consequence: Undesired outcome if all protection layers fail (fire, explosion, toxic release, environmental damage)
Independent Protection Layer (IPL): Safeguard that prevents or mitigates consequence, independent of initiating event and other IPLs
Probability of Failure on Demand (PFD): Likelihood that IPL will not function when needed (dimensionless, 0 to 1)
Risk Reduction Factor (RRF): Inverse of PFD; RRF = 1/PFD
Tolerable Risk: Maximum acceptable frequency for consequence category (company-specific risk criteria)
Why LOPA matters: LOPA provides a structured, repeatable method to demonstrate that process risks are reduced to acceptable levels. It is required by IEC 61511 for determining SIL requirements and is widely used in oil & gas, chemicals, and other process industries to comply with OSHA PSM and EPA RMP regulations.
LOPA vs. Other Risk Methods
Method
Type
Effort
Precision
Application
HAZOP
Qualitative
High
Low (identify hazards)
Identify deviations and safeguards
LOPA
Semi-quantitative
Moderate
Moderate (order of magnitude)
SIL determination, safeguard adequacy
QRA
Quantitative
Very high
High (detailed probabilities)
Detailed risk studies, facility siting
Risk Matrix
Qualitative
Low
Very low (high/med/low)
Screening, prioritization
2. LOPA Methodology
LOPA uses a simple multiplicative model to calculate mitigated event frequency by accounting for initiating event frequency and the failure probabilities of each independent protection layer.
LOPA Equation
Mitigated Event Frequency:
f_mitigated = f_IE × PFD_IPL1 × PFD_IPL2 × ... × PFD_IPLn
Where:
f_mitigated = Frequency of consequence occurring (events/year)
f_IE = Frequency of initiating event (events/year)
PFD_IPLi = Probability of Failure on Demand for IPL i (dimensionless)
Acceptability Criterion:
f_mitigated ≤ f_tolerable
Where f_tolerable is company risk tolerance for consequence severity.
If f_mitigated > f_tolerable, additional IPLs or higher SIL required.
Required Risk Reduction:
RRF_required = f_IE / f_tolerable
This RRF must be achieved by combination of IPLs.
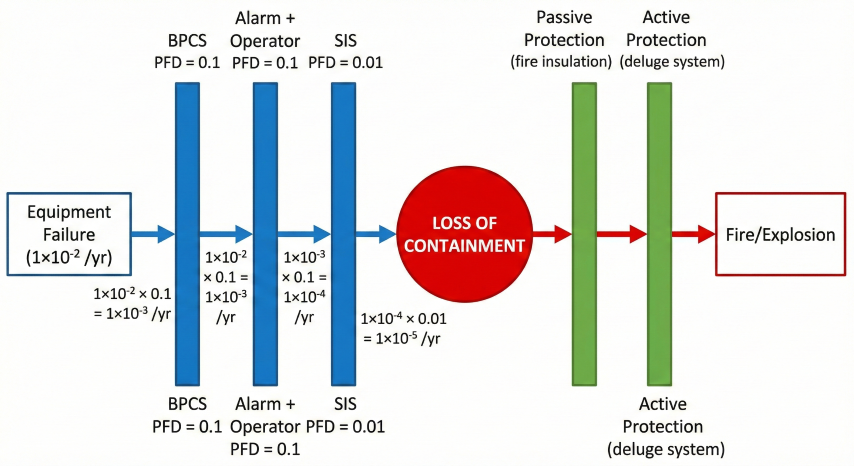
LOPA bow-tie diagram showing how IPLs reduce initiating event frequency through multiplicative PFD values to achieve tolerable risk.
LOPA Procedure (6 Steps)
Step 1: Define Scenario
Identify initiating event, consequence, and existing safeguards from HAZOP.
Example:
- Initiating event: Cooling water failure to reactor
- Consequence: Runaway reaction → explosion
- Existing safeguards: High temperature alarm, high temperature trip (SIS), relief valve
Step 2: Estimate Initiating Event Frequency
f_IE = frequency of initiating event (e.g., cooling water pump failure)
Use historical data, generic failure rates, or fault tree analysis.
Typical values:
- Equipment failure (pump, compressor): 0.1 to 1 per year
- Instrumentation failure: 0.01 to 0.1 per year
- Human error: 0.001 to 0.1 per demand
- External events (lightning): 0.0001 to 0.01 per year
Step 3: Determine Consequence Severity
Categorize consequence (fatality, injury, environmental, economic).
Select tolerable frequency based on severity (from company risk criteria).
Example:
- Minor injury: f_tol = 0.1/yr
- Major injury: f_tol = 0.01/yr
- Single fatality: f_tol = 0.001/yr
- Multiple fatality: f_tol = 0.0001/yr
Step 4: Identify IPLs
List safeguards that qualify as Independent Protection Layers.
Must meet IPL criteria:
- Independent of initiating event
- Independent of other IPLs
- Auditable effectiveness (PFD can be calculated)
- Reduces risk by ≥ 10× (PFD ≤ 0.1)
Step 5: Assign PFD Values to Each IPL
Use industry databases, manufacturer data, or calculations.
Typical PFD values:
- BPCS (DCS) alarm + operator action: 0.1 (RRF = 10)
- SIS with SIL 1: 0.01 to 0.1 (RRF = 10 to 100)
- SIS with SIL 2: 0.001 to 0.01 (RRF = 100 to 1000)
- SIS with SIL 3: 0.0001 to 0.001 (RRF = 1000 to 10000)
- Relief valve (mechanical): 0.01 (RRF = 100)
Step 6: Calculate Mitigated Frequency & Compare
f_mitigated = f_IE × Π(PFD_i)
If f_mitigated ≤ f_tolerable: risk acceptable
If f_mitigated > f_tolerable: need additional IPL or higher SIL
Example LOPA Calculation
Scenario: High pressure in gas separator could rupture vessel (multiple fatality potential):
Given:
Initiating event: Control valve fails open
f_IE = 0.5 per year (from failure rate database)
Consequence: Vessel rupture → multiple fatalities
f_tolerable = 1×10⁻⁴ per year (company risk criteria)
Existing IPLs:
1. High pressure alarm + operator closes block valve
PFD = 0.1 (per CCPS guidelines)
2. High pressure SIS trip (current SIL 1)
PFD = 0.05
3. Pressure relief valve
PFD = 0.01
Calculate mitigated frequency:
f_mitigated = 0.5 × 0.1 × 0.05 × 0.01
f_mitigated = 0.5 × 5×10⁻⁵
f_mitigated = 2.5×10⁻⁵ per year
Compare to tolerance:
2.5×10⁻⁵ < 1×10⁻⁴ → ACCEPTABLE ✓
Required RRF:
RRF_required = 0.5 / 1×10⁻⁴ = 5000
Achieved RRF:
RRF = 1/(0.1 × 0.05 × 0.01) = 1/(5×10⁻⁵) = 20,000
Margin: 20,000 / 5000 = 4× (good safety margin)
Conclusion: Current safeguards are adequate. SIL 1 trip is sufficient.
Risk Tolerance Criteria
Consequence Severity
Description
Typical f_tolerable
Example
Low
Minor injury, small spill
0.1 to 1 per year
First aid injury, < 1 bbl spill
Medium
Serious injury, moderate release
0.01 to 0.1 per year
Lost time injury, 1-10 bbl spill
High
Single fatality, major release
0.001 to 0.01 per year
1 fatality, 10-100 bbl spill
Very High
Multiple fatality, catastrophic
0.0001 to 0.001 per year
≥2 fatalities, > 100 bbl spill
3. Independent Protection Layers (IPLs)
An Independent Protection Layer must be effective, independent, and auditable. Not all safeguards qualify as IPLs—many are enabling conditions or dependent safeguards.
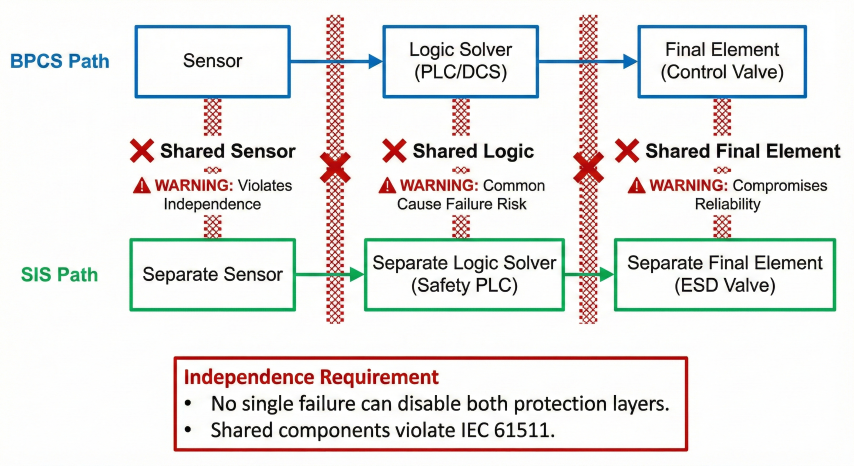
IPL independence requirement: BPCS and SIS must have separate sensors, logic solvers, and final elements to qualify as independent protection layers.
IPL Qualification Criteria
Requirements for IPL Status:
1. Specificity: Designed to prevent or mitigate specific consequence
2. Independence: Functions independently of:
- Initiating event (not same sensor, same controller)
- Other IPLs (separate sensors, logic, final elements)
3. Dependability: Reliability can be designed, managed, measured
4. Auditability: Performance can be verified through testing/inspection
5. Management of change: Changes controlled, documented, assessed
6. Effectiveness: Reduces risk by ≥10× (PFD ≤ 0.1, RRF ≥ 10)
Common IPL Types:
1. Process Design (inherently safer)
2. Basic Process Control System (BPCS) alarm + operator action
3. Safety Instrumented System (SIS) / Emergency Shutdown (ESD)
4. Physical protection (relief valves, rupture discs, blast walls)
5. Post-release protection (fire water, gas detection + isolation)
IPL Examples and Typical PFD
IPL Type
Typical PFD
RRF
Comments
Inherently safer design
0.001-0.01
100-1000
Passive, no moving parts (e.g., gravity drain, thermal siphon)
BPCS alarm + operator
0.1
10
Operator must be present, trained, have time (≥20 min), clear procedure
SIS/ESD (SIL 1)
0.01-0.1
10-100
Automated trip, independent sensors/logic/valves
SIS/ESD (SIL 2)
0.001-0.01
100-1000
Redundancy (1oo2, 2oo3), more frequent testing
SIS/ESD (SIL 3)
0.0001-0.001
1000-10000
High redundancy (2oo3, 2oo4), continuous diagnostics
Pressure relief valve
0.01
100
Mechanical spring-operated, properly sized and maintained
Rupture disc
0.001
1000
Passive device, fails safe, requires replacement after activation
Firewater deluge system
0.01-0.1
10-100
Activated by gas/fire detection or manual; mitigates consequence
What Does NOT Qualify as IPL
Enabling conditions: Conditions that must exist for scenario (e.g., "ignition source present" for fire scenario)—do not provide risk reduction
Conditional modifiers: Factors that reduce likelihood of consequence given initiating event (e.g., "wind direction favorable")—uncertain, not auditable
Administrative controls: Procedures, permits, training—important but not independent or reliable enough (PFD > 0.1 typically)
Dependent safeguards: Uses same sensor or logic as initiating event or another IPL—not independent
Maintenance/inspection: Preventive programs reduce IE frequency but are not IPLs against consequences
Common BPCS vs. SIS Distinction
BPCS (DCS) Alarm + Operator Action:
Qualifies as IPL if:
- Operator has sufficient time to respond (typically ≥20 minutes)
- Operator is always present and trained
- Clear, unambiguous alarm and procedure
- Action is simple (e.g., close one valve, push one button)
PFD = 0.1 (RRF = 10) is standard assumption
If time < 20 min or complex action: NOT an IPL
SIS (Safety Instrumented Function):
Qualifies as IPL if:
- Independent sensors (not shared with BPCS)
- Independent logic solver (separate from BPCS)
- Independent final elements (separate valves, not same as BPCS control)
- Meets SIL target via design, testing, maintenance
PFD determined by:
- Component failure rates
- Architecture (1oo1, 1oo2, 2oo3)
- Proof test interval
- Common cause failure factors
SIS provides higher reliability (lower PFD) than BPCS alarm.
Independence is critical: A safeguard that uses the same pressure transmitter as the failed control loop is NOT independent and cannot be counted as an IPL. SIS must have dedicated sensors, logic, and final elements separate from the BPCS to qualify as IPL.
4. Probability of Failure on Demand (PFD)
PFD quantifies the likelihood that a protection layer will fail to operate when required. For SIS, PFD is calculated based on component failure rates, system architecture, and test intervals.
PFD for Simple System (1oo1)
Average PFD for Single Component:
PFD_avg ≈ (λ_DU × TI) / 2
Where:
λ_DU = Dangerous undetected failure rate (failures per hour)
TI = Proof test interval (hours)
Factor of 2 assumes failures occur uniformly over test interval.
Example:
Pressure transmitter:
λ_DU = 5×10⁻⁷ per hour (from SIL database)
TI = 1 year = 8760 hours
PFD_avg = (5×10⁻⁷ × 8760) / 2
PFD_avg = 0.00438 / 2
PFD_avg = 0.00219 ≈ 0.002
This is SIL 2 range (0.001 to 0.01).
PFD for Redundant Systems
1oo2 (One out of Two - OR Logic):
Both channels must fail for system to fail (high availability).
PFD_avg ≈ β × (λ_DU × TI) / 2 + (1 - β) × (λ_DU × TI)²
Where:
β = Common cause factor (typically 0.02 to 0.10)
For low PFD:
PFD_avg ≈ β × PFD_single
Example (β = 0.05):
PFD_1oo2 ≈ 0.05 × 0.002 = 0.0001 (SIL 3 range)
2oo3 (Two out of Three - Voting Logic):
Two of three channels must vote to trip (balance reliability and availability).
PFD_avg ≈ 3 × β × (λ_DU × TI) / 2 + 3 × (1 - β) × (λ_DU × TI)² / 4
Provides good balance between spurious trips and dangerous failures.
Typical PFD_2oo3 ≈ 0.0002 to 0.002 (SIL 2-3)
Safety Instrumented Function (SIF) PFD
Complete SIF (Sensor → Logic → Final Element):
PFD_SIF = PFD_sensor + PFD_logic + PFD_final_element
For series components:
PFD_total ≈ Σ PFD_i (when PFD << 1)
Example SIF Calculation:
High pressure trip (1oo1):
- Pressure transmitter: PFD = 0.002
- Logic solver: PFD = 0.001
- Block valve + actuator: PFD = 0.005
PFD_SIF = 0.002 + 0.001 + 0.005 = 0.008
This is SIL 2 (range 0.001 to 0.01) ✓
With 1oo2 Sensors and 1oo1 Logic/Valve:
PFD_SIF = PFD_sensors(1oo2) + PFD_logic + PFD_valve
PFD_SIF = 0.0001 + 0.001 + 0.005 = 0.0061
Still SIL 2, but lower PFD (higher margin).
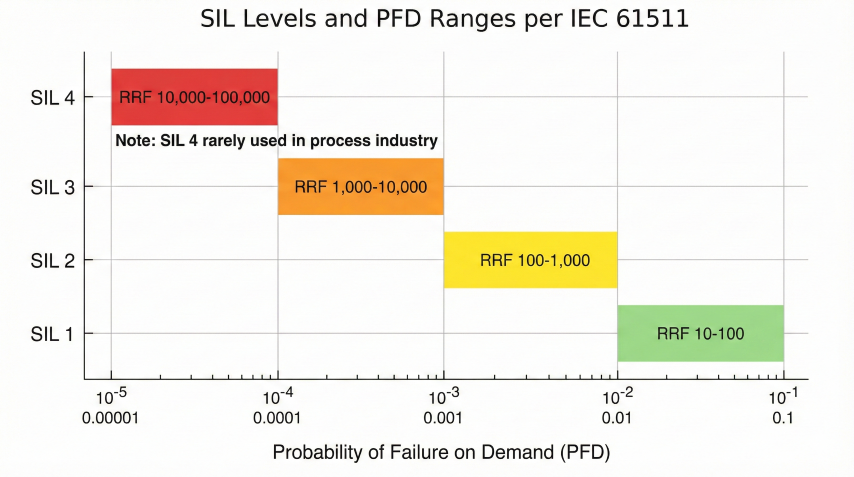
SIL levels and corresponding PFD ranges per IEC 61511, with Risk Reduction Factor (RRF) annotations.
SIL Classification
SIL
PFD_avg Range
RRF Range
Typical Architecture
SIL 1
0.01 to 0.1
10 to 100
1oo1, annual testing
SIL 2
0.001 to 0.01
100 to 1000
1oo2, 2oo3, or 1oo1 with 6-month testing
SIL 3
0.0001 to 0.001
1000 to 10000
2oo3, 2oo4, continuous diagnostics
SIL 4
0.00001 to 0.0001
10000 to 100000
Rarely used in process industries (nuclear, aviation)
Effect of Proof Test Interval
Test Interval
PFD_avg (1oo1, λ=5E-7/hr)
SIL
Comment
1 month
0.00018
SIL 3
Very frequent, high maintenance cost
6 months
0.0011
SIL 2
Common for critical SIFs
1 year
0.0022
SIL 2
Standard test interval
2 years
0.0044
SIL 2
Less maintenance, higher PFD
5 years
0.011
SIL 1
Exceeds SIL 2 limit
Test interval optimization: Reducing proof test interval from 1 year to 6 months cuts PFD in half, potentially upgrading from SIL 1 to SIL 2 without hardware changes. However, more frequent testing increases maintenance cost and introduces risk of human error during testing. Optimize based on required SIL and operational constraints.
5. SIL Determination & IEC 61511
Safety Integrity Level (SIL) is determined by the required risk reduction that a Safety Instrumented Function (SIF) must provide. IEC 61511 and ANSI/ISA-84 define the SIL framework and lifecycle requirements.
SIL Determination Methods
Method 1: LOPA (Preferred in Process Industry)
Required RRF for SIF:
RRF_SIF = RRF_total_required / RRF_other_IPLs
Where:
RRF_total_required = f_IE / f_tolerable
RRF_other_IPLs = Product of RRFs for non-SIS IPLs
Select SIL based on RRF_SIF:
- RRF 10-100 → SIL 1
- RRF 100-1000 → SIL 2
- RRF 1000-10000 → SIL 3
Example:
f_IE = 1 per year
f_tolerable = 0.0001 per year
RRF_total_required = 1 / 0.0001 = 10,000
Other IPLs:
- Alarm + operator: RRF = 10
- Relief valve: RRF = 100
RRF_other_IPLs = 10 × 100 = 1000
RRF_SIF = 10,000 / 1000 = 10
→ SIL 1 required for SIF
Method 2: Risk Graph (Qualitative)
Consider:
- Consequence severity (C1-C4)
- Occupancy/exposure (F1-F2)
- Probability of avoiding hazard (P1-P2)
- Demand rate (W1-W3)
Follow decision tree to SIL (a, b, 1, 2, 3).
Less precise than LOPA but useful for screening.
Method 3: Risk Matrix
Plot frequency vs. severity.
Cell color indicates required SIL or "no SIS required".
Simplest method but least accurate.
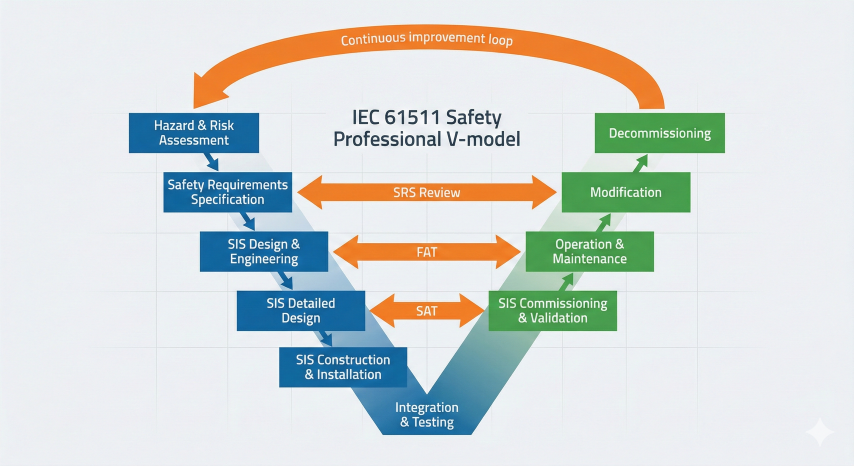
IEC 61511 safety lifecycle V-model showing development, verification, and operation phases with validation activities.
IEC 61511 Safety Lifecycle
IEC 61511 Lifecycle Phases:
Phase 1: Hazard and Risk Assessment
- Identify hazards (HAZOP, What-If, etc.)
- Determine risk (LOPA, QRA)
- Allocate risk reduction to protection layers
- Determine required SIL for each SIF
Phase 2: SIS Design
- Develop SIF specifications (SRS - Safety Requirements Specification)
- Select sensors, logic, final elements
- Calculate PFD to verify SIL target achieved
- Design for testability and maintainability
Phase 3: Installation and Commissioning
- Factory acceptance testing (FAT)
- Site acceptance testing (SAT)
- Proof testing before startup
Phase 4: Operation and Maintenance
- Proof testing at defined intervals
- Respond to demands, spurious trips
- Manage bypasses and overrides
- Collect failure data for performance monitoring
Phase 5: Modification
- Management of change (MOC) for any SIS changes
- Re-validate SIL after modifications
Phase 6: Decommissioning
- Safe removal from service
SIL Verification Calculation Example
Verify that proposed SIF design meets SIL 2 target (PFD < 0.01):
Design:
- 2 pressure transmitters (1oo2)
- Single logic solver
- 1 block valve with solenoid
Component failure rates (from IEC 61508 database):
λ_DU (pressure transmitter) = 4×10⁻⁷ per hour
λ_DU (logic solver) = 1×10⁻⁶ per hour
λ_DU (valve + solenoid) = 3×10⁻⁶ per hour
Proof test interval: 1 year = 8760 hours
Common cause factor β = 0.05
Calculate PFD for each subsystem:
Sensors (1oo2):
PFD_sensor = β × (λ × TI) / 2
PFD_sensor = 0.05 × (4×10⁻⁷ × 8760) / 2
PFD_sensor = 0.05 × 0.00175 = 0.000088
Logic solver (1oo1):
PFD_logic = (1×10⁻⁶ × 8760) / 2 = 0.00438
Final element (1oo1):
PFD_valve = (3×10⁻⁶ × 8760) / 2 = 0.01314
Total SIF PFD:
PFD_SIF = 0.000088 + 0.00438 + 0.01314
PFD_SIF = 0.0176
Result: 0.0176 > 0.01 → DOES NOT MEET SIL 2 ✗
Valve is limiting component.
Redesign Option 1: Add valve redundancy (1oo2)
PFD_valves = 0.05 × 0.01314 = 0.000657
PFD_SIF = 0.000088 + 0.00438 + 0.000657 = 0.005125
0.005125 < 0.01 → MEETS SIL 2 ✓
Redesign Option 2: Reduce test interval to 6 months
TI = 4380 hours
PFD_valve = (3×10⁻⁶ × 4380) / 2 = 0.00657
PFD_SIF = 0.000044 + 0.00219 + 0.00657 = 0.0088
0.0088 < 0.01 → MEETS SIL 2 ✓
Regulatory and Standards Framework
Standard
Scope
Region
Key Requirements
IEC 61511
Functional safety - SIS for process industry
International
SIL determination, lifecycle, management systems
ANSI/ISA-84
SIS for process industries (US adoption of IEC 61511)
USA
Same as IEC 61511 with minor differences
IEC 61508
Generic functional safety standard
International
Basis for IEC 61511; used for component certification
OSHA PSM
Process Safety Management (29 CFR 1910.119)
USA
Requires hazard analysis, SIS considered safeguard
EPA RMP
Risk Management Plan (40 CFR 68)
USA
Worst-case scenarios, prevention programs, SIS common
Common SIL Selection Mistakes
Counting dependent IPLs: Using same sensor for BPCS and SIS—not independent, cannot count both
Overestimating operator reliability: Assuming operator response is reliable IPL when time is < 20 min or action is complex
Ignoring common cause: Redundant components can fail from same cause (vibration, temperature, installation error)—must apply β factor
Neglecting proof testing: Assuming SIS will work after years without testing—PFD increases linearly with test interval
Over-reliance on single IPL: Designing SIL 3 SIS instead of adding diverse IPLs (defense in depth principle)
Inadequate SRS: Vague safety requirements specification leads to SIS that doesn't address actual hazard
SIL is not a design target—it's a result: Do not start design by saying "we need SIL 2." Instead, perform LOPA to determine required risk reduction, then design SIS to achieve that target. Verify through PFD calculation that design meets SIL. Higher SIL is not always better—it adds cost and complexity. Use combination of IPLs rather than single high-SIL SIS.
LOPA is a semi-quantitative risk assessment method that evaluates Independent Protection Layers and their Probability of Failure on Demand to determine required SIL levels.
What standard governs LOPA for functional safety?+
IEC 61511 is the primary functional safety standard used with LOPA for SIL determination in the process industries.
What is an Independent Protection Layer (IPL)?+
An IPL is a safety device, system, or action capable of preventing a hazardous event, with a quantifiable Probability of Failure on Demand.