1. VLE Fundamentals
Flash calculations determine how a feed mixture splits into vapor and liquid phases at given conditions. Essential for separator design, distillation, and process simulation.
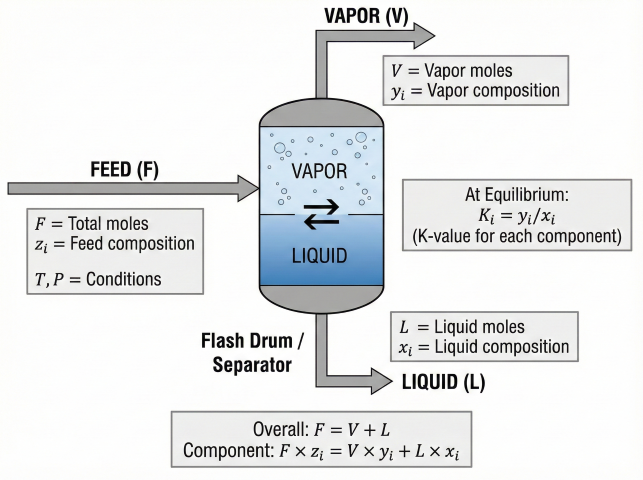
Material Balance
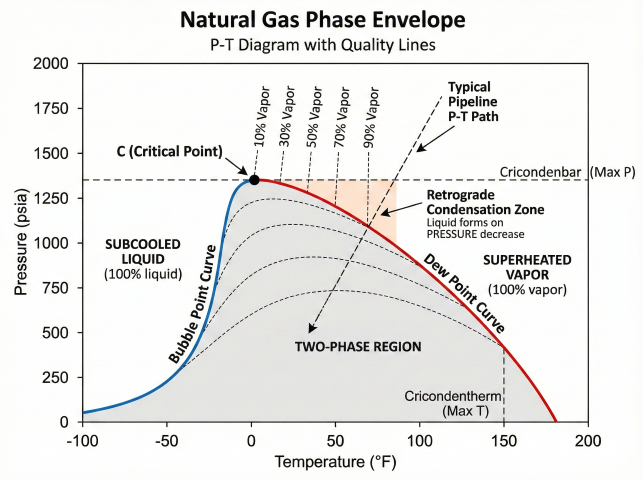
Phase Behavior
| Condition | Result |
|---|---|
| T < Bubble point | All liquid (subcooled) |
| T = Bubble point | First vapor forms |
| Bubble point < T < Dew point | Two-phase (V + L) |
| T = Dew point | Last liquid evaporates |
| T > Dew point | All vapor (superheated) |
2. K-Values (Equilibrium Ratios)
The K-value relates vapor and liquid compositions at equilibrium:
K-Value Methods
| Method | Equation | Application |
|---|---|---|
| Raoult's Law | K_i = P_i^sat / P | Ideal mixtures, low pressure |
| DePriester Charts | Graphical (T, P) | Light hydrocarbons, quick estimates |
| Wilson Correlation | K_i = (Pc_i/P) × exp(5.373(1+ω)(1-Tc_i/T)) | Hydrocarbons, first approximation |
| Equation of State | φ_i^V / φ_i^L (fugacity) | Most accurate, process simulators |
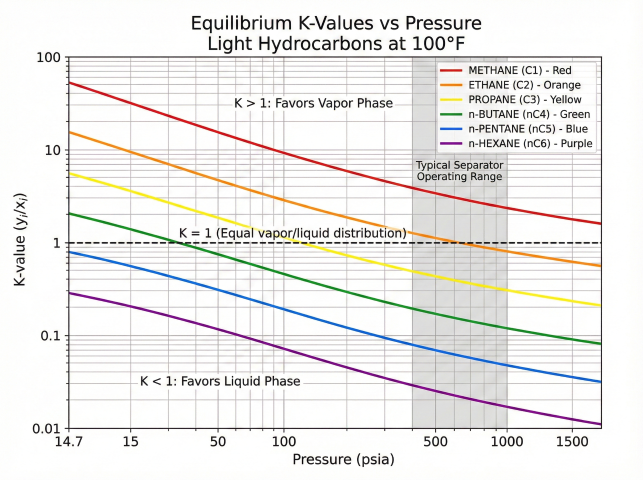
K-Value Interpretation
- K > 1: Component favors vapor phase (light components)
- K < 1: Component favors liquid phase (heavy components)
- K = 1: Equal distribution (near critical or convergence pressure)
3. Rachford-Rice Equation
The Rachford-Rice equation combines material balance and equilibrium to solve for vapor fraction (V/F):
Solution Steps
- Obtain K-values for all components at T and P
- Check if two-phase: Σz_i×K_i > 1 (bubble) and Σz_i/K_i > 1 (dew)
- Solve Rachford-Rice for V/F
- Calculate compositions: x_i = z_i / (1 + (V/F)(K_i - 1)), y_i = K_i × x_i
- Calculate flows: V = F × (V/F), L = F - V
Convergence Checks
| Test | Result | Conclusion |
|---|---|---|
| Σ(z_i × K_i) < 1 | Below bubble point | All liquid |
| Σ(z_i / K_i) < 1 | Above dew point | All vapor |
| Both sums > 1 | Two-phase region | Solve R-R |
Example: Simple Flash
Feed: 60% C1, 25% C2, 15% C3 (mole) at 500 psia, 50°F
K-values: K_C1 = 4.0, K_C2 = 0.80, K_C3 = 0.25
Check: Σz_i×K_i = 0.6(4)+0.25(0.8)+0.15(0.25) = 2.6375 > 1 ✓
Check: Σz_i/K_i = 0.6/4+0.25/0.8+0.15/0.25 = 1.0625 > 1 ✓
Two-phase → Solve R-R (Newton-Raphson) → V/F ≈ 0.96
x_C1 = 0.6/(1+0.96×3) = 0.155, y_C1 = 4×0.155 = 0.62
4. Flash Types
Isothermal Flash (T-P Flash)
Given: T, P, z_i → Find: V/F, x_i, y_i
- Most common flash calculation
- Direct solution via Rachford-Rice
- Used for separator design
Adiabatic Flash
Given: H_feed, P, z_i → Find: T, V/F, x_i, y_i
- Constant enthalpy (isenthalpic)
- J-T valve expansion
- Requires iteration on T
Bubble Point Calculation
Given: T (or P), z_i, V/F = 0 → Find: P (or T)
- Condition: Σ(z_i × K_i) = 1
- First vapor bubble forms
- y_i = z_i × K_i at bubble point
Dew Point Calculation
Given: T (or P), z_i, V/F = 1 → Find: P (or T)
- Condition: Σ(z_i / K_i) = 1
- Last liquid drop evaporates
- x_i = z_i / K_i at dew point
5. Applications
Production Separator Sizing
- Flash calculation determines V and L flow rates
- Size vessel for residence time and separation efficiency
- Multi-stage separation optimizes liquid recovery
Stabilizer/Deethanizer Feed
- Determine feed phase condition
- Calculate reboiler/condenser duties
- Product composition specifications
Pipeline Flow Assurance
- Predict liquid dropout vs. pressure/temperature
- Locate slug catchers and pig receivers
- Two-phase flow regime determination
References
- GPSA, Section 25 (Flash Calculations)
- Campbell Gas Conditioning and Processing, Vol. 1
- Experiment, Inc. "Phase Equilibria in Hydrocarbon Systems" (Chemical Engineering Progress)
- API Technical Data Book – Petroleum Refining
Ready to use the calculator?
→ Launch Calculator