1. Overview & Applications
Gas density is the mass per unit volume of a gas at specified pressure and temperature. Accurate density calculations are fundamental to:
Pipeline hydraulics
Flow calculations
Reynolds number, pressure drop, erosional velocity all depend on ρ.
Metering
Mass flow rate
Orifice, turbine, and ultrasonic meters require density for mass flow.
Equipment sizing
Compressors, separators
Compressor power and separator sizing use gas density.
Custody transfer
Contract volumes
Standard volume calculations require accurate density at base conditions.
Key Concepts
- Density (ρ): Mass per unit volume, typically lb/ft³ or kg/m³
- Specific gravity (SG): Gas density relative to air density (dimensionless)
- Molecular weight (MW): Average MW of gas mixture, lb/lbmol or g/mol
- Compressibility (Z): Deviation from ideal gas behavior (Z = 1 for ideal gas)
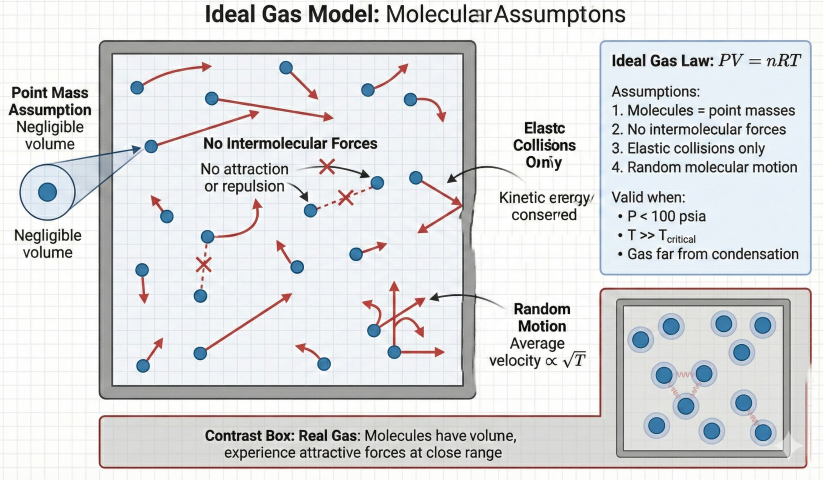
2. Ideal Gas Law
The ideal gas law assumes no intermolecular forces and that gas molecules occupy negligible volume. Valid at low pressures and high temperatures relative to the critical point.
Fundamental Equation
Density Form
Specific Gravity Form
When Ideal Gas Law Applies
| Condition | Ideal Gas Accuracy | Recommendation |
|---|---|---|
| P < 100 psia, T > 100°F | < 1% error | Use ideal gas law |
| 100 < P < 500 psia | 1–5% error | Consider Z-factor correction |
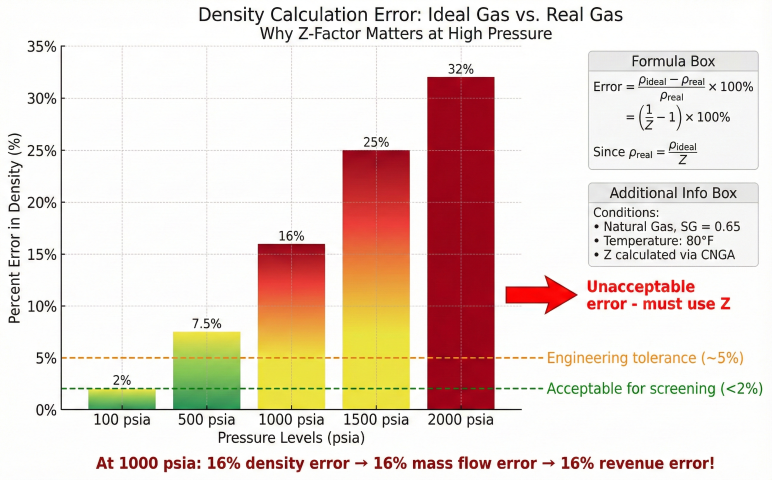
| P > 500 psia | > 5% error | Must use Z-factor or EOS |
| Near dew point | Highly inaccurate | Must use real gas equations |
Example Calculation
Calculate density of methane (MW = 16.04) at 100 psia and 80°F:
3. Real Gas & Compressibility Factor
Real gases deviate from ideal behavior due to intermolecular attractive/repulsive forces and finite molecular volume. The compressibility factor Z quantifies this deviation.
Real Gas Equation
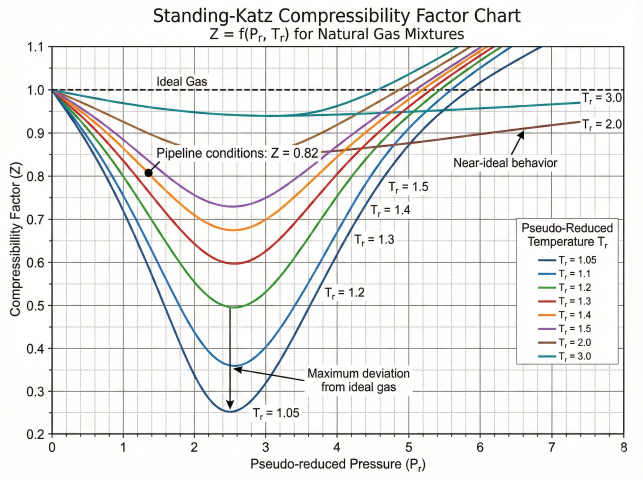
Standing-Katz Chart Method
The Standing-Katz correlation (1942) is the industry-standard graphical method for determining Z-factor from reduced pressure and temperature:
Sutton Correlation for P_pc and T_pc
When full gas composition is unavailable, use specific gravity to estimate pseudo-critical properties:
Dranchuk-Abou-Kassem (DAK) Correlation
The DAK correlation provides an explicit equation to calculate Z-factor, widely used in pipeline simulation software:
Typical Z-Factor Values
| Application | Pressure (psia) | Temperature (°F) | Typical Z |
|---|---|---|---|
| Low-pressure distribution | 50–100 | 40–100 | 0.98–1.00 |
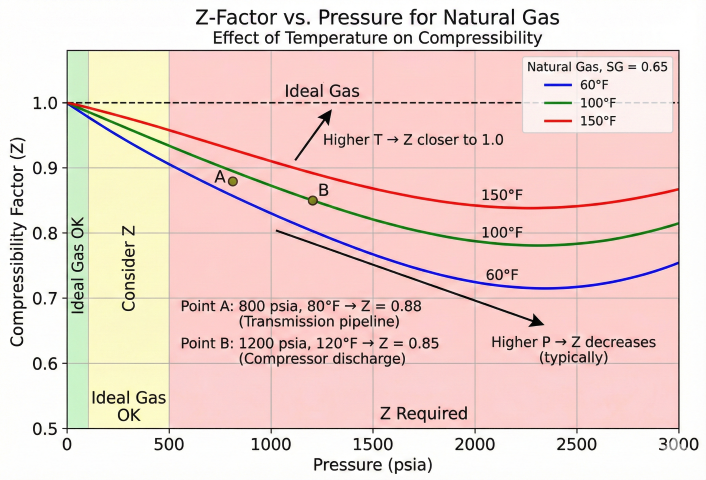
| Transmission pipeline | 800–1000 | 50–80 | 0.85–0.90 |
| High-pressure storage | 2000–3000 | 60–100 | 0.75–0.85 |
| Compressor suction | 400–600 | 80–120 | 0.90–0.95 |
| Compressor discharge | 1200–1500 | 120–180 | 0.80–0.88 |
Z-Factor Variations with Gas Composition
- Dry gas (lean): High methane content → higher T_c relative to MW → Z closer to 1.0
- Wet gas (rich): Higher ethane+ content → lower T_c → lower Z (more deviation)
- Acid gas (CO₂/H₂S): High CO₂ or H₂S → significantly affects P_c and T_c → custom correlations needed
- Nitrogen dilution: High N₂ → raises P_c → affects Z, especially at high pressure
4. Equations of State
Equations of state (EOS) relate pressure, volume, and temperature through thermodynamic models. More accurate than Z-factor charts for complex mixtures and extreme conditions.
Peng-Robinson EOS
AGA-8 Detail Method
The AGA-8 (American Gas Association Report No. 8) detail characterization method is the industry standard for custody transfer and high-accuracy applications.
GERG-2008 EOS
GERG-2008 (Groupe Européen de Recherches Gazières) is the reference equation for natural gas, similar to AGA-8 but with extended range and 21 components.
| Method | Accuracy | Application | Complexity |
|---|---|---|---|
| Ideal Gas Law | ± 1–10% | Low P, preliminary calcs | Very simple |
| Z-factor (Standing-Katz) | ± 1–2% | Pipeline, general design | Simple (chart or correlation) |
| CNGA (Dranchuk) | ± 0.5–1% | Pipeline, compressor calcs | Moderate (iterative) |
| Peng-Robinson | ± 0.5–2% | Phase behavior, VLE | Complex (requires solver) |
| AGA-8 Detail | ± 0.1% | Custody transfer, metering | Very complex (iterative) |
| GERG-2008 | ± 0.05–0.1% | Reference standard, LNG | Very complex |
When to Use Each Method
- Ideal gas: Screening studies, low-pressure (<100 psia), academic problems
- Z-factor (Standing-Katz or CNGA): Pipeline design, compressor sizing, general engineering
- Peng-Robinson: Multiphase flow, gas processing, near critical conditions
- AGA-8 or GERG: Custody transfer, revenue metering, high-accuracy requirements
5. Practical Applications
Pipeline Flow Rate Calculations
Gas density directly affects mass flow rate and Reynolds number:
Orifice Meter Flow Calculation
Orifice meters measure differential pressure to infer flow rate:
Compressor Power Calculation
Compressor power depends on inlet density and compression ratio:
Standard Volume Conversion
Convert actual flow to standard conditions for contracts and custody transfer:
Erosional Velocity Check
API RP 14E provides erosional velocity limit to prevent pipe erosion:
Common Pitfalls
- Using gauge pressure instead of absolute: Always add atmospheric pressure (14.7 psia at sea level)
- Mixing °F and °R: Gas law requires absolute temperature (°R = °F + 459.67)
- Ignoring Z-factor at high pressure: Z < 1.0 makes gas denser than ideal prediction
- Assuming constant density in long pipelines: Density varies with P/T profile along line
- Using air MW (28.97) for natural gas: Natural gas MW typically 16–22 depending on composition
- Using Z = 1.0 for custody transfer: Unacceptable for revenue metering—use AGA-8
6. Specific Heat Ratio (k)
Density is only one of the gas properties needed for equipment design. The specific heat ratio (also called the isentropic exponent or gamma) governs compression work, discharge-temperature rise, and the speed of sound — it is essential for compressor head and power calculations.
Definition
Where k Appears in Compressor Calculations
- Head calculation: the (k-1)/k term in the polytropic/adiabatic head equation
- Temperature rise: discharge temperature prediction
- Efficiency conversion: between polytropic and isentropic efficiency
- Speed of sound: c = √(k·Z·R·T / MW), which limits impeller tip speed (Mach number)
Typical k-Values
| Gas | k-Value | Notes |
|---|---|---|
| Methane (CH₄) | 1.31 | Primary natural gas component |
| Natural Gas | 1.26–1.32 | Depends on composition |
| Nitrogen (N₂) | 1.40 | Diatomic gas |
| Carbon Dioxide (CO₂) | 1.29 | Triatomic, more complex |
| Hydrogen (H₂) | 1.41 | Light diatomic gas |
| Rich Gas (C₂+) | 1.15–1.25 | Heavier components lower k |
Temperature, Pressure & Composition Effects
Unlike ideal gases where k is constant, real-gas k varies with conditions:
- Temperature: k generally decreases with increasing temperature
- Pressure: k changes significantly near critical conditions
- Composition: heavier components decrease k
7. Gas Properties for Compressor Calculations
Compressor sizing is highly sensitive to gas-property accuracy. A 5% error in Z-factor can produce a 5–10% error in head, potentially undersizing or oversizing the machine; an incorrect k gives the wrong discharge temperature. This section collects the properties and corrections most relevant to compression.
Molecular Weight Impact on Compressor Performance
For a gas mixture, the apparent molecular weight is the mole-fraction weighted average (Kay's rule): MW = Σ(yi × MWi), and SG = MW / 28.966.
- Head requirement: head is inversely proportional to MW for the same pressure ratio
- Number of stages: lighter gases require more head (more stages) per unit pressure ratio
- Impeller tip speed: limited by MW (Mach-number concerns)
- Power: MW cancels from the power equation at the same volumetric flow and pressure ratio; power depends primarily on k-value, not MW directly
Z-Factor at Multiple Conditions (Iteration)
Centrifugal compressor calculations need Z at more than one point:
- Z₁: at suction conditions (inlet density)
- Z₂: at discharge conditions (discharge density)
- Zavg: average for head calculation = (Z₁ + Z₂) / 2
Wichert-Aziz Acid-Gas Correction
For sour gas containing H₂S or CO₂, the pseudo-critical properties from Kay's rule (or Sutton, §3) must be corrected before computing reduced properties and Z:
Soave-Redlich-Kwong (SRK) Equation of State
SRK complements the Peng-Robinson EOS covered in §4. It is widely used in process simulation for vapor-phase property calculations:
A properly tuned EOS outputs all the properties a compressor calculation needs: Z, density (ρ), enthalpy (H), entropy (S), heat capacities (Cp, Cv, k), speed of sound (c), and the Joule-Thomson coefficient.
Worked Example — Multi-Component Natural Gas Density
References
- GPSA Engineering Data Book, Section 23 — Physical Properties
- API 617 — Axial and Centrifugal Compressors
- Campbell, J.M. — Gas Conditioning and Processing
- Standing, M.B. and Katz, D.L. — Density of Natural Gases (1942)
- Dranchuk, P.M. and Abou-Kassem, J.H. — Calculation of Z Factors
- Wichert, E. and Aziz, K. — Calculate Z's for Sour Gases (1972)
Ready to use the calculator?
→ Launch Calculator