Design and analyze distillation column trays using Fair's flooding correlation, GPSA methods, and FRI guidelines for weeping, entrainment, and pressure drop.
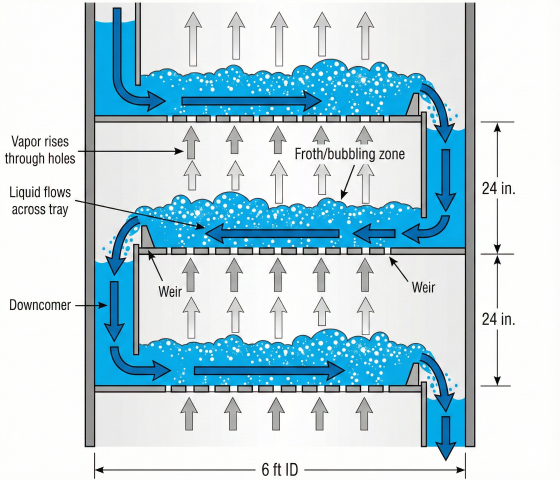
Tray columns (plate columns) achieve vapor-liquid contact through horizontal trays stacked inside a vertical shell. Vapor rises through openings in each tray, contacts liquid flowing across the tray, and continues upward. Liquid flows over an outlet weir, down a downcomer, to the tray below.
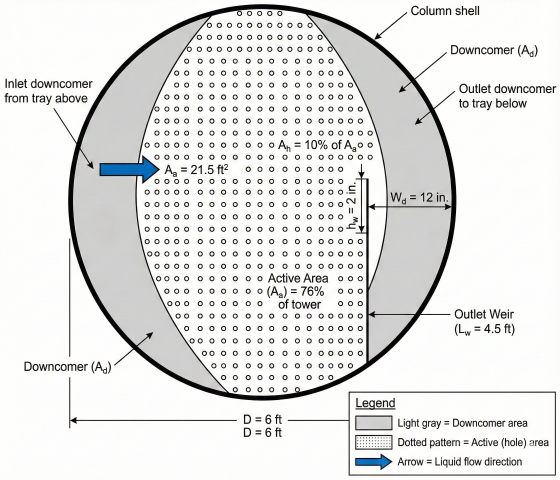
Plan view of distillation tray showing active area, downcomers, weir, and liquid flow path.
Active Area (Aa): Bubbling zone where vapor-liquid contact occurs; typically 70-85% of tower cross-section
Hole Area (Ah): Total open area of perforations; typically 8-14% of active area for sieve trays
Downcomer Area (Ad): Vertical channel for liquid flow to tray below; typically 10-15% of tower area per side
Weir Height (hw): Height of outlet dam; typically 2-3 inches; sets minimum liquid level
Tray Spacing: Vertical distance between trays; typically 18-24 inches for standard service
Net Area (An): Tower area minus one downcomer; vapor flow area above tray
Design Consideration: Active area determines capacity. Higher active area (smaller downcomers) increases vapor capacity but may limit liquid handling. Balance based on L/V ratio.
2. Flooding Correlations
Flooding occurs when vapor rate is high enough to prevent proper liquid drainage, causing liquid accumulation and loss of separation. Two flooding mechanisms exist: jet (entrainment) flooding from excessive vapor velocity, and downcomer flooding from liquid backup.
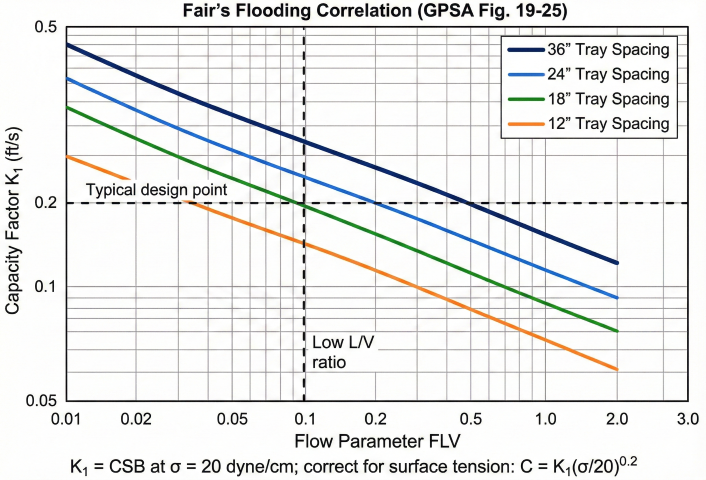
Fair's Flooding Correlation
The most widely used method for predicting jet flooding is Fair's correlation (1961), adopted in GPSA Section 19. It uses the Souders-Brown capacity factor:
Souders-Brown Flood Velocity:
Vflood = CSB × √[(ρL - ρV) / ρV]
Where:
Vflood = Maximum vapor velocity through active area (ft/s)
CSB = Capacity factor at flooding (ft/s)
ρL = Liquid density (lb/ft³)
ρV = Vapor density (lb/ft³)
Fair's Capacity Factor:
CSB = K₁ × (σ/20)^0.2
Where:
K₁ = Capacity constant from Fair's chart (function of FLV and tray spacing)
σ = Surface tension (dyne/cm), baseline = 20 dyne/cm
Flow Parameter (FLV)
The flow parameter relates liquid-to-vapor loading and determines K₁:
Flow Parameter:
FLV = (L/V) × √(ρV/ρL)
Where:
L = Liquid mass flow rate (lb/hr)
V = Vapor mass flow rate (lb/hr)
Tray spacing correction: K₁ scales with (Ts/24)^0.5 where Ts is tray spacing in inches.
Design Operating Point
Percent of Flood:
% Flood = (Vactual / Vflood) × 100
Design Recommendation:
• Normal operation: 70-85% of flood
• Maximum design: 80% of flood (10-15% margin for upsets)
• Below 50%: May have efficiency issues
• Above 90%: Risk of flooding with minor upsets
Troubleshooting: Flooding symptoms include sharp pressure drop increase, loss of separation, and liquid carryover to overhead. Gamma scanning can diagnose location without shutdown.
3. Pressure Drop Calculations
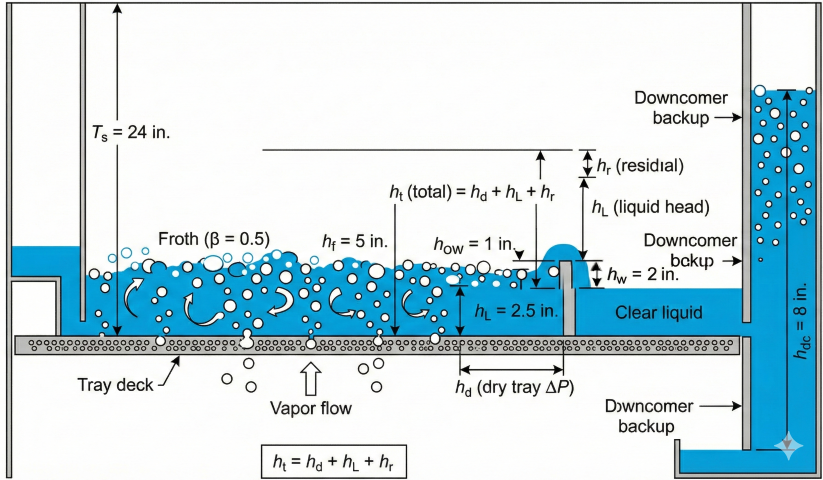
Tray pressure drop consists of three components: dry tray drop (vapor through holes), liquid head on tray, and residual drop (surface tension effects).
Total Tray Pressure Drop:
ht = hd + hL + hr (inches of liquid)
Where:
hd = Dry tray pressure drop
hL = Clear liquid height on tray
hr = Residual pressure drop
Dry Tray Pressure Drop
Sieve Tray Dry Drop:
hd = 0.186 × (ρV/ρL) × (Vh/C₀)²
Where:
Vh = Vapor velocity through holes (ft/s)
C₀ = Orifice coefficient (typically 0.72-0.78)
Result in inches of liquid
Orifice Coefficient C₀:
• Depends on plate thickness / hole diameter ratio
• For t/dh = 0.5-1.0: C₀ ≈ 0.73-0.76
• Higher hole area ratio → higher C₀
Liquid Head Components
Clear Liquid Height:
hL = β × (hw + how)
Where:
β = Aeration factor (froth density ratio, typically 0.3-0.7)
hw = Weir height (inches)
how = Height of liquid over weir (inches)
Francis Weir Formula:
how = 0.48 × Fw × (QL/Lw)^(2/3)
Where:
QL = Liquid flow rate (gpm)
Lw = Weir length (inches)
Fw = Weir constriction factor (≈1.0 for straight weirs)
Bennett Aeration Factor
The aeration factor accounts for vapor holdup in the froth on the tray:
Bennett Correlation:
β = exp(-12.55 × Ks^0.91)
Where:
Ks = Va × √[ρV/(ρL - ρV)]
Va = Vapor velocity through active area (ft/s)
Typical values:
• Low vapor rate (F-factor < 0.5): β ≈ 0.7-0.8
• Normal operation: β ≈ 0.4-0.6
• High vapor rate (F-factor > 2): β ≈ 0.3-0.4
Tray hydraulic profile showing liquid levels, froth height, and pressure drop components.
Typical Pressure Drop Values
Tray Type
ΔP Range
Notes
Sieve tray
2-4 in H₂O
Lowest ΔP; simple design
Valve tray
2-5 in H₂O
Valve weight adds to dry drop
Bubble cap
4-8 in H₂O
Highest ΔP due to slot resistance
Vacuum Service: Minimize pressure drop for vacuum distillation. Use low weir height (1-1.5"), high hole area (12-15%), and consider structured packing instead.
4. Weeping & Turndown
Weeping occurs when vapor velocity is too low to support the liquid on the tray. Liquid drains ("weeps") through the holes, bypassing vapor-liquid contact and reducing efficiency.
Weeping Criterion
Minimum Hole Velocity (Lockett):
Vh,min = K × √[(hL/12) × (ρL - ρV)/ρV]
Where:
K = Weeping constant (0.10-0.13 depending on hole area ratio)
hL = Clear liquid height (inches)
Result in ft/s
Weeping Factor K:
• Hole area < 8% of active: K ≈ 0.10
• Hole area 8-12%: K ≈ 0.11
• Hole area 12-15%: K ≈ 0.12
• Hole area > 15%: K ≈ 0.13
Design Margin:
Actual hole velocity should be at least 20% above minimum to ensure adequate turndown capability.
Turndown Ratio
The operable range between weeping and flooding defines turndown capability:
Turndown Ratio:
Turndown = Vflood / Vweep
Typical values:
• Sieve tray: 2-3:1 (limited by weeping)
• Valve tray: 5-8:1 (valves close at low rates)
• Bubble cap: 10-20:1 (vapor always bubbles through liquid)
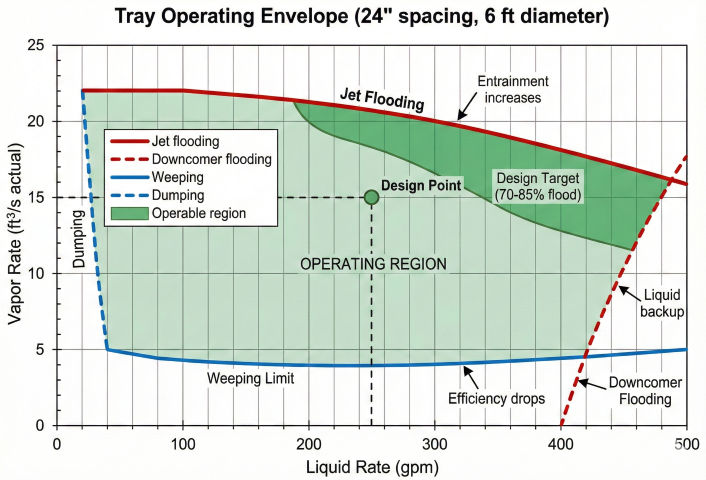
Tray operating envelope showing operable region bounded by flooding and weeping limits.
Downcomer Flooding
Liquid backup in the downcomer must not exceed available height:
Downcomer Backup:
hdc = ht + hw + how + hda
Where:
ht = Total tray pressure drop (inches liquid)
hw = Weir height (inches)
how = Height over weir (inches)
hda = Downcomer apron loss (typically 0.5-1.0 inches)
Flooding Criterion:
hdc < 0.5 × (Tray spacing - 3")
Design limit is typically 50% of available downcomer height.
Valve Tray Advantage: At low vapor rates, valve caps close to maintain hole velocity, preventing weeping. This provides 5-8:1 turndown vs 2-3:1 for sieve trays.
5. Tray Efficiency
Tray efficiency quantifies how closely actual separation approaches theoretical equilibrium. Higher efficiency means fewer trays required for a given separation.
Liquid carryover to the tray above reduces apparent efficiency:
Entrainment Correlation (Hunt):
ψ ≈ 0.02 × (%Flood/70)^4 × (24/Ts)^0.5
Where:
ψ = Fractional entrainment (liquid entrained / total liquid)
Ts = Tray spacing (inches)
Effect on Efficiency:
Eactual ≈ EMV × (1 - ψ/2)
Design Limit:
Keep ψ < 0.10 (10%) for good efficiency
At 80% flood with 24" spacing: ψ ≈ 4-6%
Design Margin: Add 10-15% extra trays above calculated requirements to account for efficiency uncertainty, fouling degradation, and future capacity increases.