Size deethanizer, depropanizer, debutanizer and butane-splitter columns using Fenske-Underwood-Gilliland shortcut methods for preliminary design, then detailed tray-by-tray simulation for final sizing. (The demethanizer is a refluxed cryogenic absorber and is outside the FUG shortcut scope of this tool.)
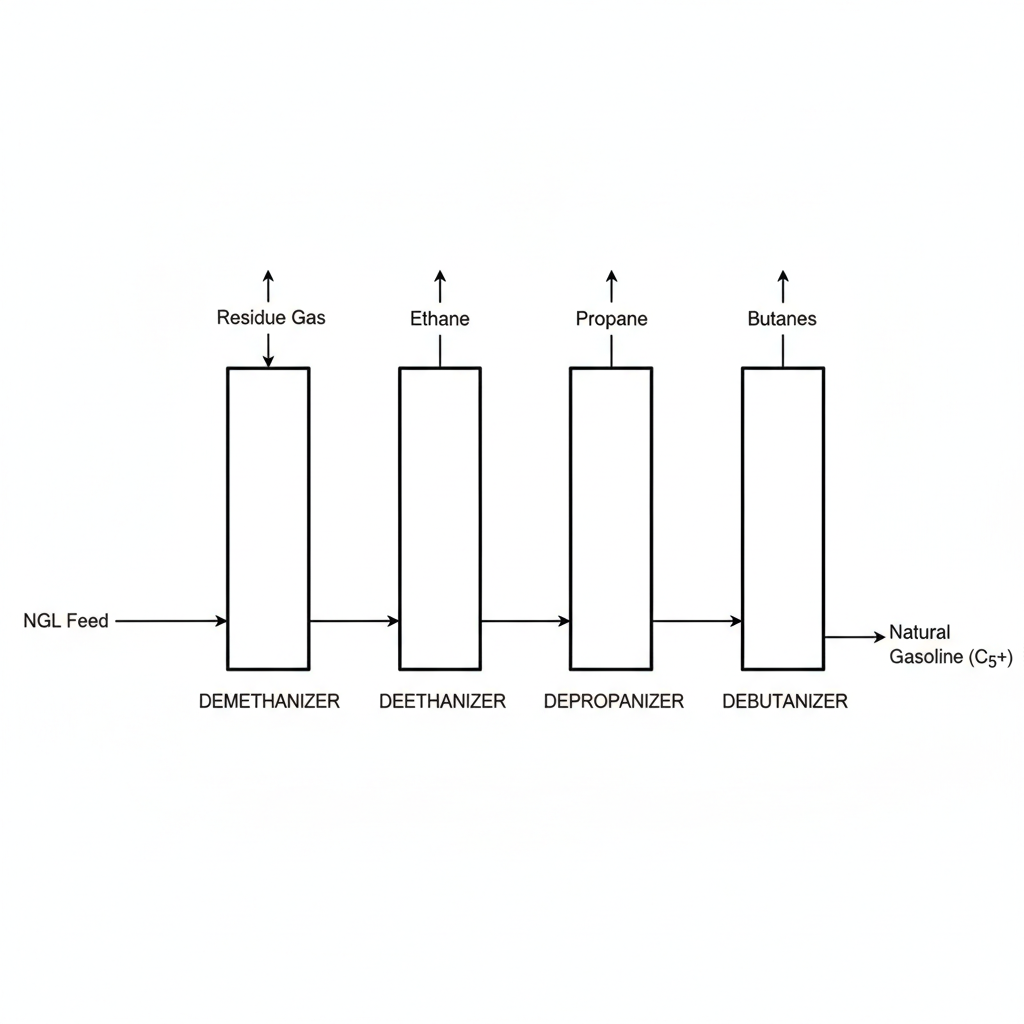
NGL fractionation separates mixed natural gas liquids into pure component products (ethane, propane, butane, natural gasoline) using a series of distillation columns. Each column operates at progressively lower pressure and higher temperature moving downstream.
NGL Fractionation Train Process Flow Diagram - Demethanizer → Deethanizer → Depropanizer → Debutanizer sequence with product streams
Why fractionation sequence matters: Operating columns in order of decreasing volatility (DeC1 → DeC2 → DeC3 → DeC4) allows heat integration. Overhead vapor from a downstream column can be used as reboiler heat source for an upstream column, significantly reducing overall energy consumption. Typical heat integration saves 30-50% vs standalone columns.
Product Recovery Targets
Ethane recovery (demethanizer): 90-98% depending on economics. Higher recovery → more ethane product revenue but larger column and higher refrigeration cost. Ethane rejection mode: < 10% recovery (maximize methane purity for pipeline sales).
Propane recovery (deethanizer): > 99% of C3 in DeC2 bottoms goes to depropanizer. Minimal propane in ethane product (spec: < 5 mol% C3+ in ethane).
Natural gasoline (debutanizer): > 98% of C5+ recovered in bottoms. Vapor pressure control critical: limit C4 in gasoline to meet RVP spec (typically 8-12 psi).
2. Fenske-Underwood-Gilliland Method
The FUG shortcut method estimates theoretical stages and reflux ratio for binary or pseudo-binary separations. Widely used for preliminary column sizing before rigorous tray-by-tray simulation.
Fenske Equation (Minimum Stages at Total Reflux)
Fenske Equation:
N_min = log[(x_LK,D / x_HK,D) × (x_HK,B / x_LK,B)] / log(α_avg)
Where:
N_min = Minimum theoretical stages (at total reflux, R = ∞)
x_LK,D = Mole fraction of light key in distillate (overhead)
x_HK,D = Mole fraction of heavy key in distillate
x_LK,B = Mole fraction of light key in bottoms
x_HK,B = Mole fraction of heavy key in bottoms
α_avg = Average relative volatility of LK to HK
α_avg = √(α_top × α_bottom)
Where α = (y_LK / x_LK) / (y_HK / x_HK) = K_LK / K_HK
Example: Depropanizer (C3/iC4 separation)
x_C3,overhead = 0.97 (97% C3 purity)
x_iC4,overhead = 0.025
x_C3,bottoms = 0.01 (1% C3 in bottoms)
x_iC4,bottoms = 0.40
At 230°F, 240 psia:
K_C3 ≈ 1.15, K_iC4 ≈ 0.52
α = 1.15 / 0.52 = 2.21 (assume α_avg ≈ 2.2 across column)
N_min = log[(0.97/0.025) × (0.40/0.01)] / log(2.2)
N_min = log[38.8 × 40] / log(2.2)
N_min = log(1552) / 0.342
N_min = 3.191 / 0.342 = 9.3 theoretical stages (minimum)
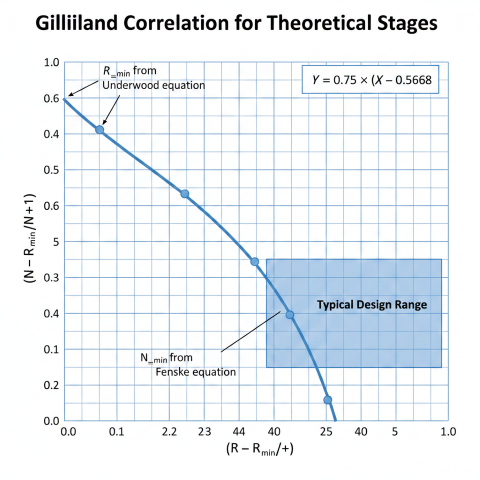
Gilliland Correlation Chart - Relationship between actual stages, minimum stages, and reflux ratio
Gilliland Correlation:
Relates actual stages N to minimum stages N_min and operating/minimum reflux:
Y = [N - N_min] / [N + 1]
X = [R - R_min] / [R + 1]
Gilliland empirical fit:
Y = 1 - exp{[(1 + 54.4X) / (11 + 117.2X)] × [(X - 1) / √X]}
Alternatively, simplified approximation:
N = N_min + N_min × f(X)
Where f(X) is read from Gilliland chart or calculated from correlation.
Example (continued):
N_min = 9.3 stages
R_min = 1.62
R_operating = 2.1
X = (2.1 - 1.62) / (2.1 + 1) = 0.48 / 3.1 = 0.155
Using Gilliland correlation:
Y = 1 - exp{[(1 + 54.4×0.155)/(11 + 117.2×0.155)] × [(0.155-1)/√0.155]}
Y = 1 - exp{[9.43 / 29.17] × [-0.845 / 0.394]}
Y = 1 - exp{0.323 × (-2.14)}
Y = 1 - exp(-0.691) = 1 - 0.501 = 0.499
N = (N_min + Y) / (1 - Y)
N = (9.3 + 0.499) / 0.501 = 19.6 theoretical stages
Add tray efficiency correction (E ≈ 0.7-0.9 for hydrocarbon distillation):
N_actual = N / E = 19.6 / 0.80 = 25 actual trays
Feed Tray Location (Kirkbride Equation)
Kirkbride Equation for Optimal Feed Tray:
log(N_R / N_S) = 0.206 × log[(B/D) × (x_HK,F / x_LK,F) × (x_LK,B / x_HK,D)²]
Where:
N_R = Number of stages in rectifying section (above feed)
N_S = Number of stages in stripping section (below feed)
B/D = Bottoms to distillate flow ratio (molar)
x_HK,F, x_LK,F = Heavy/light key fractions in feed
x_LK,B, x_HK,D = Light key in bottoms, heavy key in distillate
(Reference: Perry's 9th Ed §13; McCabe-Smith-Harriott Eq. 21.42; Treybal Eq. 9.131)
Example:
B/D = 0.65 (more distillate than bottoms for depropanizer)
x_C3,feed = 0.60, x_C4,feed = 0.30
x_C3,bottoms = 0.01, x_C4,overhead = 0.025
log(N_R/N_S) = 0.206 × log[0.65 × (0.30/0.60) × (0.01/0.025)²]
log(N_R/N_S) = 0.206 × log[0.65 × 0.50 × 0.16]
log(N_R/N_S) = 0.206 × log(0.052) = 0.206 × (-1.284) = -0.265
N_R/N_S = 10^(-0.265) = 0.544
If N_total = 25 actual trays:
N_R = 25 × 0.544 / (1 + 0.544) = 8.8 ≈ 9 trays above feed
N_S = 25 - 9 = 16 trays below feed
Feed tray location: Tray 9 from top (or tray 16 from bottom)
FUG method limitations: FUG shortcut is reliable for binary and pseudo-binary systems with constant relative volatility (α varies < 20% across column). For multicomponent systems or non-ideal mixtures (e.g., close-boiling C4 splitter), use rigorous tray-by-tray simulation (HYSYS, Aspen Plus, ProMax). FUG provides ±10-20% estimate for preliminary sizing; always confirm with rigorous model before final design.
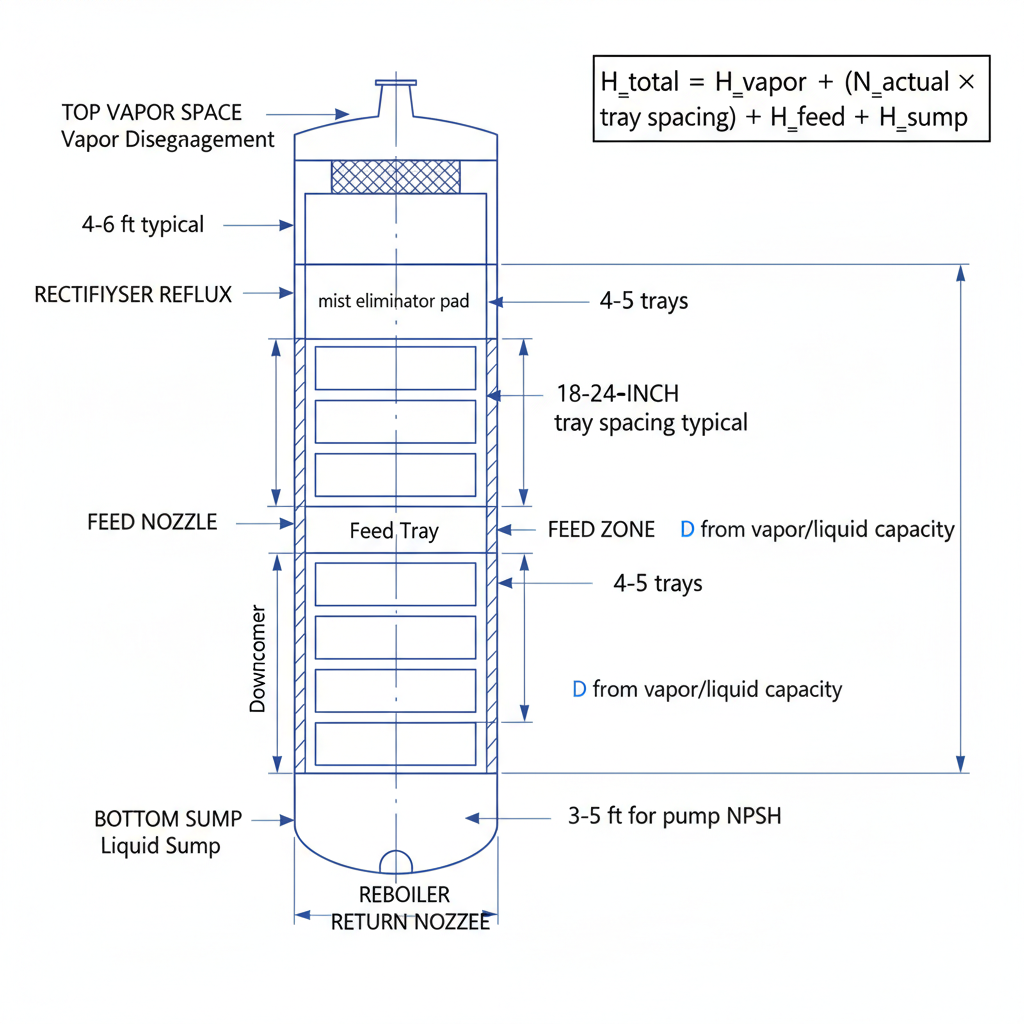
3. Column Diameter & Height Sizing
Column diameter is determined by vapor flow rate and allowable velocity (to prevent flooding or excessive entrainment). Column height is based on number of trays and tray spacing.
Column Diameter (Tray Columns)
Distillation Column Schematic with Dimensions - Tray spacing, vapor disengagement, and sump zones
Flooding Velocity Method (Fair Correlation):
C_flood = K × √[(ρ_L - ρ_V) / ρ_V]
Where:
C_flood = Flooding capacity parameter (ft/s)
K = Capacity factor (from Fair chart, function of L/V and FP_L)
ρ_L = Liquid density (lb/ft³)
ρ_V = Vapor density (lb/ft³)
FP_L = Flow parameter
Flooding velocity:
v_flood = C_flood / √(ρ_V)
Design velocity (to avoid flooding):
v_design = 0.75 to 0.85 × v_flood (75-85% of flood)
Column cross-sectional area:
A = Q_V / v_design
Where Q_V = vapor volumetric flow rate (ft³/s)
Diameter:
D = √(4A / π)
Example: Depropanizer overhead conditions
P = 240 psia, T = 130°F
Vapor rate = 5,000 lb-mol/hr C3 (MW = 44)
ρ_V = 3.2 lb/ft³ (at operating P,T)
ρ_L = 32 lb/ft³ (propane liquid)
L/V (molar) = 2.1 (from reflux ratio R = 2.1)
From Fair chart at L/V = 2.1: K ≈ 0.35 (for sieve trays, 24" spacing)
C_flood = 0.35 × √[(32 - 3.2) / 3.2] = 0.35 × √9.0 = 1.05 ft/s
v_design = 0.80 × 1.05 = 0.84 ft/s
Q_V = (5000 lb-mol/hr × 44 lb/lb-mol) / (3.2 lb/ft³ × 3600 s/hr)
Q_V = 220,000 / 11,520 = 19.1 ft³/s
A = 19.1 / 0.84 = 22.7 ft²
D = √(4 × 22.7 / 3.1416) = 5.4 ft = 65 inches
Commercial size: 6 ft (72") diameter
Column Height
Total Column Height:
H_total = H_trays + H_top + H_bottom
Where:
H_trays = N_actual × t_spacing
N_actual = Number of actual trays
t_spacing = Tray spacing (18-36 inches, typically 24")
H_top = Height above top tray for vapor disengagement (3-6 ft)
H_bottom = Sump height for liquid holdup and level control (6-10 ft)
Example (depropanizer with 25 trays, 24" spacing):
H_trays = 25 × 2 ft = 50 ft
H_top = 5 ft
H_bottom = 8 ft
H_total = 50 + 5 + 8 = 63 ft
Add skirt: 4 ft → Total tip-to-tip = 67 ft
Aspect ratio check: H/D = 63 / 6 = 10.5:1 (acceptable; typical 10-30:1)
Tray Spacing Selection
Tray Spacing
Application
Pros
Cons
18 inches
Small columns (D < 4 ft), low L/V ratio
Shorter column, lower cost
Difficult maintenance access, lower capacity
24 inches
Standard for most NGL columns (D = 4-12 ft)
Good balance of cost, capacity, maintainability
Standard choice, few drawbacks
30-36 inches
Large columns (D > 10 ft), high fouling service
Easy maintenance, high turndown, less fouling
Taller column (higher cost), more internals weight
Pressure Drop per Tray
Tray Pressure Drop:
ΔP_tray = ΔP_dry + ΔP_liquid + ΔP_residual
Where:
ΔP_dry = Dry tray pressure drop (vapor through holes)
= K × (ρ_V × v_h²) / (2 × g_c)
K = orifice coefficient (~1.5-2.0 for sieve trays)
v_h = hole velocity (ft/s)
ΔP_liquid = Liquid head on tray
= h_L × ρ_L / 144 (in psi, h_L in inches, ρ_L in lb/ft³)
ΔP_residual = Surface tension effects (~0.1-0.3 psi)
Typical total ΔP per tray: 0.1-0.3 psi
For 25-tray column:
ΔP_total = 25 × 0.2 psi = 5 psi overhead to bottoms
This affects:
- Reboiler temperature (higher ΔP → higher bottoms temp required)
- Condenser pressure (sets overhead operating pressure)
- Compressor design (if overhead vapor compressed)
Diameter Variation Along Column
In practice, column diameter may vary between rectifying and stripping sections due to different vapor loads:
Top section (above feed): Vapor rate = (R + 1) × D (distillate rate). High reflux → large vapor load → larger diameter.
Bottom section (below feed): Vapor rate = (R + 1) × D + Feed_vapor - Bottoms_liquid. Can be larger or smaller than top section depending on feed thermal condition.
Tapered columns: Some designs use larger diameter in high-vapor-rate section, smaller in low-rate section. Saves steel cost but adds complexity. More common in large demethanizers.
Constant diameter: Most NGL columns use single diameter sized for maximum vapor load section plus 10-20% margin. Simpler fabrication and operation.
Column diameter safety factor: Always size column diameter for 75-85% of flooding velocity, NOT 100%. This provides: (1) turndown capability for feed rate variations, (2) margin for fouling over time, (3) tolerance for off-spec feed composition, (4) lower tray pressure drop (improves efficiency). Operating near flooding causes excessive entrainment, poor separation efficiency, and potential liquid carryover to overhead.
4. Tray vs Packed Column Selection
NGL fractionators can use either tray (sieve, valve, bubble-cap) or packed (random, structured) internals. Selection depends on diameter, turndown requirements, pressure drop constraints, and fouling potential.
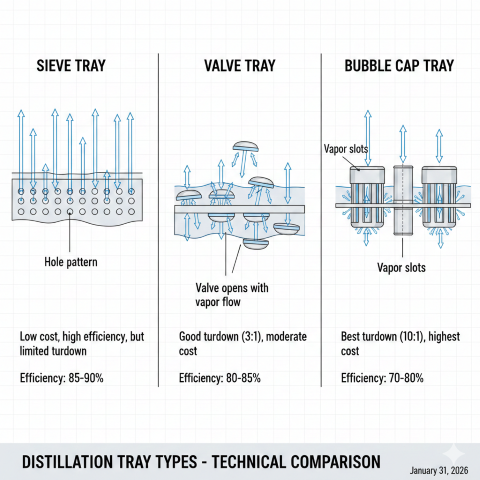
Tray Types for NGL Service
Distillation Tray Types Comparison - Sieve, Valve, and Bubble-Cap designs with vapor flow patterns
Tray Type
Capacity
Efficiency
ΔP per Tray
Cost
NGL Application
Sieve tray
High
70-80%
0.1-0.2 psi
Low
Most common; depropanizer, debutanizer
Valve tray
High
75-85%
0.15-0.25 psi
Moderate
Better turndown; deethanizer, varying loads
Bubble-cap tray
Moderate
60-75%
0.2-0.4 psi
High
Rare in new designs; legacy columns only
High-performance tray (e.g., Nye, MVGT)
Very high
85-95%
0.08-0.15 psi
High
Revamps, capacity increases; any column
Structured Packing for NGL Columns
HETP (Height Equivalent to Theoretical Plate):
Structured packing efficiency expressed as HETP rather than tray efficiency.
HETP = Height of packing that provides one theoretical stage of separation
Typical HETP for NGL service:
- Structured packing (e.g., Mellapak 250Y, Flexipac): 18-24 inches
- High-performance structured packing (e.g., Mellapak 2X, Montz B1-500): 12-16 inches
Required packing height:
H_packing = N_theoretical × HETP
Example (depropanizer with 20 theoretical stages):
Using Mellapak 250Y (HETP = 20 inches):
H_packing = 20 × 20" = 400" = 33.3 ft
Compare to tray column:
N_actual = 20 / 0.80 (eff) = 25 trays
H_tray = 25 × 24" = 600" = 50 ft
Structured packing → 33% shorter column
But: Structured packing more expensive per ft than trays
Trade-off: Lower shell cost vs higher internals cost
Tray vs Packing Selection Criteria
Criterion
Favor Trays
Favor Structured Packing
Column diameter
D > 4 ft (large)
D < 3 ft (small, lab-scale)
Pressure drop
Not critical (ΔP < 10 psi OK)
Low ΔP required (vacuum, low-P service)
Fouling potential
Dirty service, solids, polymers
Clean service only (packing blinds easily)
Turndown
Valve trays: 3:1 turndown
Structured packing: 5:1+ turndown
Capital cost
Lower first cost (trays cheaper)
Accept higher internals cost for shorter column
Liquid rate
High L/V (> 5), high liquid loads
Low to moderate L/V (< 3)
Revamp/retrofit
Existing tray column debottleneck
Increase capacity in existing shell (add stages)
Typical NGL Column Selections
Demethanizer: Sieve or valve trays. Large diameter (6-12 ft), high pressure, moderate fouling from heavy ends. Trays easier to inspect/clean. Some new designs use structured packing in top section (cryogenic) for low ΔP.
Deethanizer: Sieve trays most common. Moderate diameter (4-8 ft), clean service. Structured packing used in small units (< 1000 BPD NGL feed).
Depropanizer: Sieve trays standard. 4-10 ft diameter. Clean, low-fouling service. HD-5 spec requires high efficiency → high-performance trays (Koch MVGT, Sulzer CPCT) sometimes used for tight C2/C4 control.
Debutanizer: Sieve trays. 3-8 ft diameter. Heavier components (C5+) can foul → trays preferred over packing for ease of cleaning.
Butane splitter (iC4/nC4): High-performance structured packing (e.g., Montz B1) for maximum efficiency. Requires 80-120 theoretical stages; packing HETP = 12-14" → 80-110 ft packed height. Very tall column (140-180 ft T-T).
Internals selection economics: For typical NGL service (clean, moderate pressure, D > 4 ft), sieve trays are most economical. Structured packing justified when: (1) low pressure drop critical (vacuum or cryogenic), (2) very high efficiency required (difficult separations), (3) retrofitting existing shell (add stages without retraying), or (4) very high turndown needed (seasonal/variable loads). Always compare lifecycle cost (capital + energy + maintenance) over 20-year project life.
5. Product Specifications & Recovery Optimization
NGL product specifications are set by pipeline tariffs, sales contracts, and downstream use requirements. Meeting specs while maximizing recovery determines column design and operating parameters.
Ethane Product Specifications
Specification
Pipeline Grade
Purity Grade
Test Method
Ethane content
> 80 mol%
> 95 mol%
GC analysis (ASTM D2163)
Propane (max)
< 5 mol%
< 2 mol%
GC analysis
Methane (max)
< 15 mol%
< 3 mol%
GC analysis
Ethylene (if present)
Report
< 1000 ppm
GC analysis
H₂O content
< 10 ppmw
< 10 ppmw
Karl Fischer (ASTM D1744)
H₂S
< 4 ppmv
< 1 ppmv
Lead acetate or detector tube
Propane Product Specifications (HD-5)
ASTM D1835 (HD-5 Propane):
HD-5 = "Heavy-Duty" propane (propylene ≤ 5 mol%) for residential/commercial use
Key specifications:
- Propane content: ≥ 90 mol% (typical: 95-98%)
- Propylene: ≤ 5 mol%
- Butane and heavier: ≤ 2.5 mol%
- Ethane and lighter: Report (typical < 2 mol%)
- Vapor pressure @ 100°F: 208 psig maximum (ASTM D1267)
- Residue volatility @ 36°F: 95% evaporated (dryness test)
- Residue on evaporation: 0.05 mL max (oil stain)
- H₂S: < 4 ppmv (lead acetate negative)
- Total sulfur: < 140 ppmw (ASTM D2784)
- Corrosion, copper strip: No. 1 max (ASTM D1838)
- Moisture: Pass (no free water)
Commercial propane (less stringent than HD-5):
- Propane + propylene: ≥ 85%
- Vapor pressure: 215 psig max
- Used for chemical feedstock, motor fuel
Meeting HD-5 spec requires:
1. Tight C2 removal in deethanizer (minimize ethane carryover)
2. Effective C4 separation in depropanizer (minimize butane overhead)
3. Low condenser temperature for vapor pressure control
4. Treating for sulfur removal if sour feed
Butane and Natural Gasoline Specs
Product
Key Specification
Typical Value
Purpose/Impact
Normal butane
Purity (nC4)
> 95 mol%
Alkylation feedstock, LPG blending
Isobutane
Purity (iC4)
> 95-99 mol%
Alkylation feedstock (requires high purity)
Mixed butanes
C4 content
> 90 mol%
LPG blending, petrochemical feed
Natural gasoline (C5+)
RVP (Reid Vapor Pressure)
8-12 psi
Gasoline blending (seasonal spec)
Natural gasoline
Density (API gravity)
60-80°API
Quality indicator; lighter = higher value
Natural gasoline
Sulfur content
< 50 ppmw
Gasoline blending (EPA Tier 3: 10 ppm in finished gas)
Ethane Recovery Optimization
Ethane Recovery Economic Trade-off:
Higher ethane recovery in demethanizer:
+ More ethane product volume → higher revenue
+ Less ethane in sales gas → higher gas heating value (small benefit)
- Larger demethanizer (more trays, larger diameter)
- More refrigeration duty (colder overhead condenser)
- Lower methane purity in overhead (more re-circulation)
Typical recovery modes:
1. Ethane rejection: < 10% C2 recovery
- Maximize methane sales gas (pipeline)
- Small/no demethanizer overhead condenser
- Low capital, low operating cost
2. Moderate recovery: 70-85% C2 recovery
- Balance ethane product revenue vs capital cost
- Moderate refrigeration (-10 to +20°F condenser)
3. High recovery: 90-98% C2 recovery
- Maximize ethane product (if ethane price > gas price on $/MMBtu basis)
- Large demethanizer, heavy refrigeration (-30 to -10°F)
- High capital and operating cost
Economic breakeven:
If P_ethane ($/gal) / P_gas ($/MMBtu) > 0.85, favor ethane recovery
If P_ethane / P_gas < 0.70, favor ethane rejection
Example:
Ethane = $0.25/gal, Gas = $3.00/MMBtu
Ratio = 0.25 / 3.00 = 0.083 (VERY low → reject ethane, don't build recovery)
Ethane = $0.30/gal, Gas = $2.50/MMBtu
Ratio = 0.30 / 2.50 = 0.12 (Moderate → 70-80% recovery may be optimal)
This is highly dynamic; plants often operate in swing mode (recovery vs rejection)
depending on real-time market prices.
Propane Recovery and HD-5 Compliance
Meeting HD-5 propane spec requires tight control of both lighter (C2) and heavier (C4+) components:
Ethane carryover: Deethanizer must remove > 99.5% of ethane from C3+ bottoms. Ethane in propane increases vapor pressure and fails HD-5 spec. Monitor deethanizer bottoms composition; adjust reboiler duty or reflux to minimize C2 slip.
Butane carryover: Depropanizer overhead must be < 2.5 mol% C4+. Excess butane fails HD-5 and reduces propane price. Adjust depropanizer reflux ratio or operating pressure to tighten C3/C4 split.
Vapor pressure control: RVP = f(composition + temperature). If propane has 2% ethane and 2% butane, RVP ≈ 200-205 psig @ 100°F (within HD-5 208 psig limit). If 3% ethane, RVP exceeds 208 psig → off-spec. Use correlation or lab test (ASTM D1267) to verify.
Seasonal variations: Winter propane specs sometimes allow higher vapor pressure (less critical for heating). Summer specs tighter. Adjust depropanizer operation seasonally to match market specs and optimize revenue.
Product spec vs recovery trade-off: Tightening product specifications (e.g., reducing ethane in propane from 2% to 0.5%) requires higher reflux ratio, more trays, and larger column. This reduces ethane recovery (more ethane reports to propane, then recycled to deethanizer or lost). Optimize by setting specs at contractual minimums, not tighter. Every 1% increase in reflux ratio costs ~2-3% more energy but may only improve purity by 0.5%. Use rigorous simulation to find economic optimum reflux for target recovery and spec compliance.
What is the Fenske-Underwood-Gilliland method for NGL column sizing?+
The FUG method is a shortcut approach that estimates minimum stages (Fenske equation at total reflux), minimum reflux (Underwood equations), and actual stages vs. reflux (Gilliland correlation) for preliminary distillation column sizing before rigorous simulation.
What is a typical NGL fractionation train sequence?+
The standard sequence is demethanizer (C1/C2 split), deethanizer (C2/C3), depropanizer (C3/iC4), debutanizer (nC4/iC5), and optionally a butane splitter (iC4/nC4). Each column operates at progressively lower pressure moving downstream.
How much energy does heat integration save in NGL fractionation?+
Operating columns in order of decreasing volatility allows heat integration where overhead vapor from a downstream column serves as reboiler heat for an upstream column. Typical heat integration saves 30–50% of energy compared to standalone columns.
What is the Kirkbride equation used for in column design?+
The Kirkbride equation estimates the optimal feed tray location by computing the ratio of rectifying to stripping stages based on feed composition, product compositions, and the bottoms-to-distillate flow ratio.