Gas Water Content: McKetta-Wehe Engineering Fundamentals
Calculate natural gas water content using McKetta-Wehe charts, GPSA correlations, and ISO 18453 methods for accurate dehydration design, hydrate prevention, and pipeline integrity.
Water content in natural gas is the amount of water vapor present at specified pressure and temperature conditions. Excessive water causes hydrate formation, pipeline corrosion, and reduced heating value. Accurate water content calculations are critical for:
Hydrate prevention
Pipeline integrity
Water forms solid hydrates with methane/ethane at high P, low T—blocking flow.
Corrosion control
Internal corrosion
Free water enables CO₂/H₂S corrosion; dewpoint control prevents condensation.
Dehydration design
Glycol systems
TEG/MEG contactor sizing requires accurate inlet and outlet water content.
Custody transfer
Contract specs
Gas sales contracts specify max water content (typically 4-7 lb/MMscf).
Key Concepts
Water content (W): Mass of water vapor per standard volume of gas (lb H₂O/MMscf or mg/Nm³)
Water dewpoint: Temperature at which water vapor condenses at given pressure
Saturation: Gas in equilibrium with liquid water (maximum water content at P/T)
Hydrate point: P/T condition where solid gas hydrates form (typically 40-60°F at pipeline pressures)
PPM (mole basis): Parts per million water on molar basis (ppmv = mole fraction × 10⁶)
Why Water Content Matters
Problem
Cause
Consequence
Prevention
Gas hydrates
Water + CH₄ at high P, low T
Pipeline blockage, flow stoppage
Dehydration or methanol injection
Internal corrosion
Free water + CO₂/H₂S
Pipe wall thinning, leaks
Keep water below dewpoint
Slug flow
Water accumulation in low spots
Compressor damage, meter errors
Drip pots, line drains
Reduced capacity
Water vapor displaces gas
Lower heating value delivery
Maintain spec water content
Freezing
Free water at T < 32°F
Ice blockage, instrument failure
Glycol injection or heating
Industry standards: ASME B31.8 requires gas transmission pipelines to maintain water content below saturation at minimum operating temperature to prevent hydrate formation and internal corrosion. API RP 500 provides guidance on dewpoint specifications for custody transfer.
Typical Water Content Values
Gas Condition
Pressure (psia)
Temperature (°F)
Water Content (lb/MMscf)
Wellhead (raw gas)
1000
120
80-120
Separator outlet
800
100
60-90
After glycol dehydration
800
100
2-4
Pipeline specification
800-1200
60-80
≤ 7
Transmission pipeline
1000
60
4-6
2. McKetta-Wehe Charts
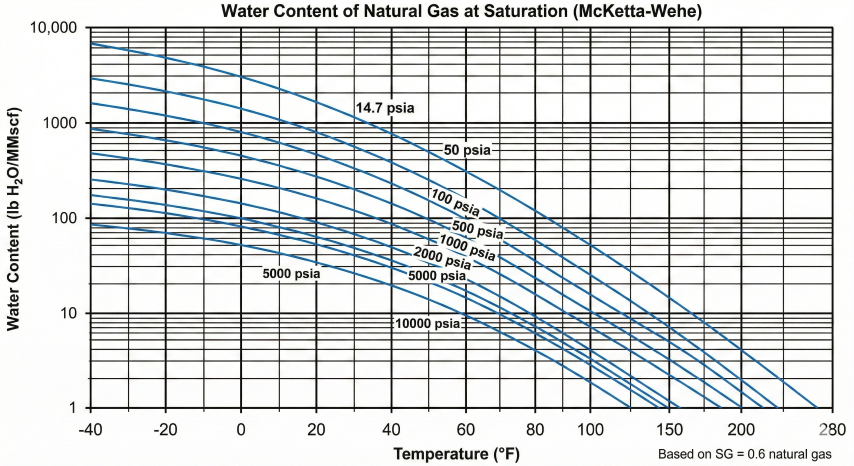
The McKetta-Wehe chart (GPSA, Figure 20-4) is the industry-standard graphical method for determining water content of natural gas at saturation. Developed empirically from experimental data, valid for sweet natural gas (no acid gas correction).
Chart Usage Method
McKetta-Wehe Procedure:
1. Locate temperature on X-axis (°F)
2. Follow vertical line to intersection with pressure curve
3. Read water content on Y-axis (lb H₂O/MMscf)
4. Apply corrections for:
- Gas gravity (if SG ≠ 0.6)
- Salt concentration in free water
- Acid gas content (CO₂/H₂S)
Typical Reading:
At 100°F and 1000 psia:
W ≈ 60 lb H₂O/MMscf (from chart/Bukacek)
Gas Gravity Correction
The McKetta-Wehe chart is based on SG = 0.6. For other gas gravities, apply correction factor:
Gravity Correction Factor (GPSA Fig 20-4):
Correction Factor (Cg) = 1.0 − 0.067 × (SG − 0.6)
Where SG = gas specific gravity (air = 1.0)
W_corrected = W_chart × Cg
Heavier gas holds slightly LESS water, so Cg < 1.0 for SG > 0.6.
Example for SG = 0.7:
Cg = 1.0 − 0.067 × (0.7 − 0.6) = 0.993
W_corrected = 65 × 0.993 = 64.6 lb/MMscf
Note: Correction is small (< 5%) for typical natural gas (SG = 0.55–0.90)
Salinity Correction
Salt dissolved in free water lowers water vapor pressure, reducing equilibrium water content:
CO₂ and H₂S increase water solubility, raising equilibrium water content above the McKetta-Wehe chart:
CO₂ Correction (Sharma-Campbell):
B_CO2 = A₁ + A₂/T + A₃/T² + A₄/T³
Where:
T = Temperature (°R)
A₁, A₂, A₃, A₄ = empirical constants
W_mix = W_HC × (1 - y_CO2 - y_H2S) + W_CO2 × y_CO2 + W_H2S × y_H2S
Where:
y_i = mole fraction of component i
W_HC = hydrocarbon water content from McKetta-Wehe
W_CO2, W_H2S = pure component water contents
Typical impact:
10% CO₂: +5% water content
20% CO₂: +10% water content
5% H₂S: +8% water content
Pressure-Temperature Relationship
McKetta-Wehe chart (GPSA Figure 20-4 style) for determining saturated water content of natural gas at various pressures and temperatures.
Temperature (°F)
100 psia
500 psia
1000 psia
2000 psia
60
127
30
18
12
80
249
58
34
22
100
465
105
60
38
120
825
184
104
64
140
1403
309
172
104
160
2296
501
277
164
Water content in lb H₂O/MMscf at saturation for SG=0.6 gas. Values calculated using Bukacek correlation (equivalent to McKetta-Wehe chart, GPSA Section 20). Accuracy ±5%.
Chart limitations: McKetta-Wehe chart accuracy decreases above 300°F or below -40°F. For extreme conditions, use Bukacek correlation or rigorous thermodynamic models (Peng-Robinson EOS).
Example Calculation
Calculate saturated water content for natural gas (SG = 0.65, 5% CO₂) at 1000 psia and 100°F with 3% salt concentration:
Step 1: Calculate base water content at 100°F, 1000 psia
W_base = 60 lb/MMscf (from Bukacek/McKetta-Wehe, SG = 0.6)
Step 2: Apply gas gravity correction (GPSA Fig 20-4)
Cg = 1.0 − 0.067 × (0.65 − 0.6) = 0.997
W_gravity = 60 × 0.997 = 59.8 lb/MMscf
Step 3: Apply salinity correction
Cs = 1 - (0.00134 × 3) = 0.996
W_salt = 59.8 × 0.996 = 59.6 lb/MMscf
Step 4: Apply acid gas correction (illustrative; not done by the calculator)
For 5% CO₂ at these conditions: +5% increase
W_final = 59.6 × 1.05 = 62.6 lb/MMscf
Result: Saturated water content ≈ 63 lb H₂O/MMscf
If actual water content is 7 lb/MMscf (pipeline spec), gas is well below saturation:
Dewpoint depression ≈ 25-35°F below operating temperature
3. GPSA & ISO Correlations
Analytical correlations provide computer-friendly alternatives to graphical McKetta-Wehe charts. These equations are programmed into flow computers, SCADA systems, and process simulators.
Bukacek Correlation
The Bukacek equation (1955) is widely used for hand calculations and spreadsheet applications:
Bukacek Water Content Equation:
W = (Pv / P) × A + B
Where:
W = Water content (lb H₂O/MMscf)
P = System pressure (psia)
Pv = Water vapor pressure at temperature T (psia)
A = 47430 (GPSA constant for lb/MMscf conversion)
B = Non-ideal gas correction factor
B coefficient calculation:
log₁₀(B) = -3083.87 / T + 6.69449
T = Temperature (°R = °F + 459.67)
First term (Pv/P × A): Ideal gas contribution (Raoult's Law)
Second term (B): Non-ideal correction for gas solubility effects
Water Vapor Pressure (Antoine Equation):
log₁₀(Pv) = A - B / (C + T)
For water (T in °C, Pv in mmHg):
A = 8.07131, B = 1730.63, C = 233.426 (valid 1-100°C)
A = 8.14019, B = 1810.94, C = 244.485 (valid 99-374°C)
Convert: Pv (psia) = Pv (mmHg) / 51.715
Accuracy: ±5% for 60-460°F, 15-10000 psia
ISO 18453 Method
ISO 18453 (Natural gas — Correlation between water content and water dew point) provides standardized calculation methods:
ISO 18453 Water Content:
xw = (Pv / P) × f
Where:
xw = Water mole fraction
Pv = Saturated water vapor pressure (Pa)
P = System pressure (Pa)
f = Enhancement factor (accounts for non-ideality)
Enhancement factor:
f = exp[(V̄w × (P - Pv)) / (R × T)]
Where:
V̄w = Partial molar volume of water in gas phase
R = Universal gas constant (8.314 J/mol·K)
T = Temperature (K)
Convert mole fraction to lb/MMscf:
W = xw × (MW_water / MW_gas) × 379.49 × ρ_std
Typical values:
f = 1.0-1.2 for low pressure (< 500 psia)
f = 1.2-1.5 for high pressure (1000-2000 psia)
Ning-Anderko-Saul Correlation
The Ning correlation (2012) extends accuracy to high pressures and temperatures encountered in deep gas wells:
Ning-Anderko-Saul Model:
ln(yw) = ln(Pv/P) + (Bwg - Vw∞) × P / (R × T) + ln(φw)
Where:
yw = Water mole fraction
Bwg = Second virial coefficient for water-gas interaction
Vw∞ = Infinite dilution partial molar volume of water
φw = Water fugacity coefficient
Valid range:
0-200°C (32-392°F)
0-200 MPa (0-29000 psia)
Accuracy: ±2% across full range
Required: Gas composition for virial coefficient calculation
Comparison of Correlation Accuracy
Method
Accuracy
Valid Range (P)
Valid Range (T)
Application
McKetta-Wehe
±5-10%
15-10000 psia
-40-300°F
Hand calculations, screening
Bukacek
±5%
100-3000 psia
60-200°F
Spreadsheets, simple programs
ISO 18453
±3%
50-5000 psia
20-250°F
Flow computers, custody transfer
Ning-Anderko
±2%
0-29000 psia
32-392°F
High P/T wells, simulators
Peng-Robinson EOS
±5-10%
All pressures
All temperatures
Phase equilibrium, multiphase
Dewpoint Calculation
Given water content, calculate dewpoint by iterative solution:
Dewpoint from Water Content:
Problem: Find T_dewpoint given W (lb/MMscf) and P (psia)
Method 1 - Iterative Solution:
1. Guess initial T_dewpoint
2. Calculate W_sat at T_dewpoint and P using chosen correlation
3. Compare W_sat to known W
4. Adjust T_dewpoint and repeat until W_sat = W (within tolerance)
Method 2 - Approximate Formula (Maddox et al.):
T_dewpoint = B / (A - log₁₀(W × P / C)) - D
Where A, B, C, D are fitted constants:
A = 8.15, B = 1810, C = 53000, D = 460
Accuracy: ±5°F for pipeline conditions
Example:
W = 7 lb/MMscf, P = 1000 psia
T_dewpoint = 1810 / (8.15 - log₁₀(7 × 1000 / 53000)) - 460
T_dewpoint ≈ 35°F
Gas must be kept above 35°F to prevent condensation.
Method selection: Use McKetta-Wehe/Bukacek for typical pipeline conditions (100-1500 psia, 60-120°F). Use ISO 18453 for custody transfer and contractual calculations. Use Ning or rigorous EOS for high-pressure wells (> 3000 psia) or extreme temperatures.
4. Dehydration Systems
Dehydration removes water vapor from natural gas to meet pipeline specifications, prevent hydrate formation, and minimize corrosion. Three primary methods: glycol absorption, molecular sieves, and refrigeration.
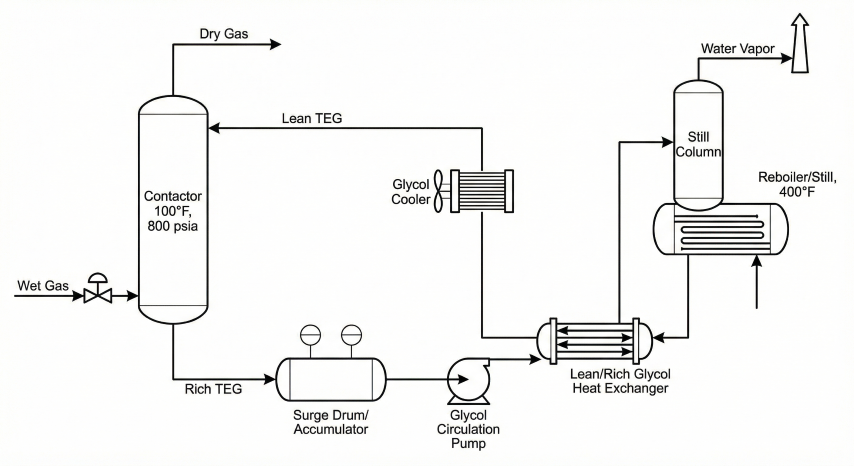
Glycol Dehydration (TEG/MEG)
TEG dehydration system process flow diagram showing major equipment and glycol circulation loop.
Triethylene glycol (TEG) absorption is the most common dehydration method in midstream operations:
TEG Contactor Design Basis:
Water removal required:
ΔW = W_inlet - W_outlet (lb H₂O/MMscf)
Glycol circulation rate:
Gal_TEG/lb_H2O = 3.0-4.0 (typical design)
Minimum circulation:
Gal_TEG = (Q_gas × ΔW) / (Conc_lean - Conc_rich)
Where:
Q_gas = Gas flow rate (MMscfd)
Conc_lean = Lean glycol concentration (wt% TEG, typically 99.0-99.5%)
Conc_rich = Rich glycol concentration (wt% TEG, typically 97-98%)
Number of theoretical trays:
N_trays = 6-8 for standard service
N_trays = 10-12 for deep dehydration (< 2 lb/MMscf)
Actual trays = N_trays / tray_efficiency (efficiency ≈ 0.25-0.33)
TEG System Performance
Lean TEG Conc.
Outlet Water Content
Dewpoint Depression
Application
98.5 wt%
10-15 lb/MMscf
20-30°F
Minimal service (rare)
99.0 wt%
5-7 lb/MMscf
30-40°F
Standard pipeline spec
99.5 wt%
2-4 lb/MMscf
40-60°F
Deep dehydration
99.9 wt% (with stripping gas)
< 1 lb/MMscf
60-80°F
Cryogenic processing feed
Molecular Sieve Dehydration
Molecular sieves (zeolites) achieve extremely low water content through adsorption:
Molecular Sieve Sizing:
Bed capacity:
Q_capacity = W_ads × M_sieve × RCF
Where:
W_ads = Water adsorption capacity (wt%, typically 10-14% for 4A zeolite)
M_sieve = Mass of sieve material (lb)
RCF = Remaining capacity factor (0.7-0.8, accounts for cycling losses)
Bed sizing:
V_bed = Q_gas × t_ads × ΔW / (Q_capacity × ρ_bulk)
Where:
t_ads = Adsorption cycle time (8-12 hours typical)
ΔW = Water loading (lb H₂O/MMscf)
ρ_bulk = Bulk density of sieve (45-50 lb/ft³)
Regeneration requirements:
- Temperature: 400-600°F
- Gas flow: 5-10% of process gas throughput
- Cycle time: 2-4 hours heating + 2-4 hours cooling
Outlet water content: < 0.1 ppmv (< 0.5 lb/MMscf)
Refrigeration Dehydration
Mechanical refrigeration condenses water by cooling gas below dewpoint:
Refrigeration System Design:
Cooling load:
Q_cool = Q_gas × ρ × Cp × ΔT
Where:
Q_gas = Gas volumetric flow (ft³/hr)
ρ = Gas density (lb/ft³)
Cp = Specific heat (Btu/lb·°F, ≈ 0.5 for natural gas)
ΔT = Temperature drop (°F)
Water removal:
W_removed = W_inlet - W_sat(T_chiller, P)
Typical performance:
Chiller temperature: 35-40°F
Outlet water content: 15-25 lb/MMscf
Application: Partial dehydration, hydrocarbon recovery
Limitations:
- Cannot achieve pipeline spec (< 7 lb/MMscf) without glycol or sieves
- Hydrate formation risk in chiller (requires methanol injection)
- High energy consumption at low temperatures
Dehydration Method Comparison
Method
Outlet Water (lb/MMscf)
Capital Cost
Operating Cost
Best Application
TEG absorption
2-7
Low
Low-moderate
Pipeline transmission, standard service
Molecular sieves
< 0.5
Moderate-high
Moderate
Cryogenic plant feed, deep dehydration
Refrigeration
15-25
Moderate
High (power)
Hydrocarbon recovery, partial dehydration
Membrane
10-20
Moderate
Low
Offshore, remote locations
Methanol injection
Not applicable
Very low
Low (chemical)
Hydrate prevention only (no dehydration)
System selection criteria: TEG is preferred for 90% of pipeline applications due to low cost and 2-7 lb/MMscf capability. Molecular sieves required for cryogenic processing (< 1 lb/MMscf) or when TEG regeneration is impractical. Refrigeration used primarily for hydrocarbon recovery with partial dehydration as secondary benefit.
Glycol Loss Mechanisms
Vaporization loss: TEG vapor carried out with gas stream (0.1-0.3 gal/MMscf typical)
Entrainment loss: Liquid droplets entrained by high gas velocity (use mist eliminator)
Flash loss: Glycol flashes when pressure drops across control valve
Filter/drain loss: Glycol removed with filters and drain systems
Degradation loss: Thermal degradation in reboiler (> 400°F causes breakdown)
Typical total glycol makeup: 0.3-0.5 gal TEG per MMscf gas processed (includes all loss mechanisms)
5. Practical Applications
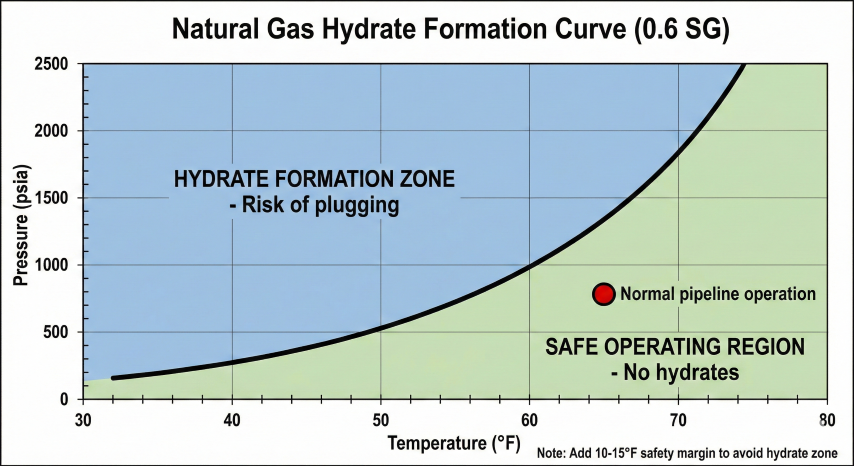
Hydrate Formation Prevention
Natural gas hydrate formation curve showing pressure-temperature boundary between safe operation and hydrate formation risk zone.
Gas hydrates form when free water exists at specific P/T combinations. Water content calculations determine if dehydration is needed:
Hydrate Prevention Strategy:
Option 1 - Maintain gas below saturation (no free water):
W_actual << W_sat at (P_min, T_min)
Safety factor: W_actual ≤ 0.7 × W_sat
Option 2 - Operate above hydrate formation temperature:
T_operating > T_hydrate + safety_margin
Typical safety margin: 10-15°F above hydrate point
Option 3 - Methanol/MEG injection (if free water present):
Methanol required (wt% in water phase) = Depression / K
Where:
Depression = T_hydrate - T_operating (°F)
K = 2300-2500 °F (empirical constant)
Example:
Depression = 20°F, K = 2400
Methanol = 20 / 2400 = 0.0083 = 0.83 wt% in water phase
Hydrate prediction: Use CSMGem, PVTsim, or similar software for multi-component systems
Pipeline Dewpoint Specification
Design pipeline operation to maintain gas temperature above dewpoint with safety margin:
Dewpoint Specification Method:
Step 1: Determine minimum operating temperature
T_min = min(T_ambient, T_chiller, T_expansion) - margin
Typical ambient: T_min = T_ambient,winter - 10°F
Step 2: Calculate maximum allowable water content
W_max = W_sat(T_min, P_max) × safety_factor
Safety factor = 0.5-0.7 (provides 10-20°F dewpoint depression)
Step 3: Set pipeline specification
Spec: "Water content shall not exceed [W_max] lb/MMscf,
equivalent to dewpoint ≤ [T_min] at [P_max] psia"
Example:
T_min = 40°F, P_max = 1000 psia
W_sat(40°F, 1000 psia) ≈ 15 lb/MMscf (from McKetta-Wehe)
With 0.5 safety factor: W_max = 7.5 lb/MMscf
Round down for conservatism: Spec = 7 lb/MMscf
This provides ~20°F dewpoint depression (dewpoint ≈ 20°F at 1000 psia)
TEG System Troubleshooting
Problem
Symptom
Likely Cause
Solution
High outlet water content
W > 7 lb/MMscf
Low lean glycol concentration
Increase reboiler temperature, check for water in still column
Gas chromatography: Separates water peak in GC analysis (requires careful calibration)
Regulatory Requirements
Standard/Code
Requirement
Application
ASME B31.8
Prevent hydrate formation and internal corrosion
Gas transmission pipeline design
API RP 500
≤ 7 lb/MMscf for custody transfer
Sales gas specifications
GPA 2174
Water content by gravimetric method
Laboratory analysis procedures
ISO 10101
Dewpoint measurement by chilled mirror
Field measurement standards
NACE MR0175
Material selection for sour service
H₂S-containing gas dehydration
Common Calculation Errors
Using gauge pressure: Water content correlations require absolute pressure (psig + 14.7)
Ignoring gas gravity correction: 0.1 SG difference = ~6% error in water content
Mixing temperature scales: Correlations use °R (°F + 459.67), not °F directly
Confusing ppmv and lb/MMscf: 1000 ppmv ≈ 47.5 lb/MMscf (mole-basis conversion; ratio is fixed regardless of gas MW)
Applying sweet gas correlations to sour gas: H₂S/CO₂ increases water content significantly
Neglecting enhancement factor: At high pressure, ideal mixing rules underpredict water content
Unit Conversions
Common Water Content Units:
lb H₂O/MMscf ↔ mg H₂O/Nm³:
mg/Nm³ = lb/MMscf × 16.0185
lb H₂O/MMscf ↔ ppmv (mole basis):
ppmv = (lb/MMscf) × 10⁶ / (MW_water × 10⁶/V_m)
= (lb/MMscf) × 21.07
Where:
MW_water = 18.015 lb/lbmol
V_m = 379.5 scf/lbmol (standard molar volume @ 60°F, 14.696 psia)
Note: ppmv is mole-basis, so gas MW does NOT appear.
Examples (independent of gas SG):
7 lb/MMscf = 112 mg/Nm³ = 147 ppmv
50 ppmv = 2.37 lb/MMscf = 38 mg/Nm³
Dewpoint conversions:
°F = (°C × 9/5) + 32
°R = °F + 459.67
K = °C + 273.15
Best practice: Always verify dewpoint specification accounts for minimum operating temperature with adequate safety margin. A 7 lb/MMscf spec at 1000 psia provides dewpoint ≈ 20-25°F, suitable for pipelines operating above 35-40°F ambient. For colder climates, specify 4 lb/MMscf or lower.
What is the typical pipeline specification for water content in natural gas?+
The typical pipeline specification is 7 lb H₂O per MMscf or less to prevent hydrate formation and internal corrosion. TEG dehydration systems typically achieve 1–4 lb/MMscf outlet water content.
How do you determine water content of natural gas using the McKetta-Wehe chart?+
Locate the temperature on the X-axis and follow to the intersection with the pressure curve to read water content on the Y-axis. Apply correction factors for gas gravity, salinity, and acid gas content (CO₂/H₂S) as needed.
Why is water content important in natural gas pipelines?+
Excessive water causes hydrate formation that can block pipelines, enables CO₂/H₂S corrosion of pipe walls, reduces gas heating value, and can cause slug flow or freezing. Accurate water content calculations are critical for dehydration design and hydrate prevention.
How does acid gas affect natural gas water content?+
CO₂ and H₂S increase water solubility in gas, raising equilibrium water content above McKetta-Wehe chart values. A 10% CO₂ content increases water content by approximately 5%, while 5% H₂S increases it by approximately 8%.