Nitrogen in natural gas reduces heating value below pipeline specifications. Unlike H₂S or CO₂, nitrogen cannot be removed by chemical absorption or adsorption—it requires cryogenic distillation or membrane permeation. NRUs are capital-intensive but achieve >95% methane recovery for large volumes.
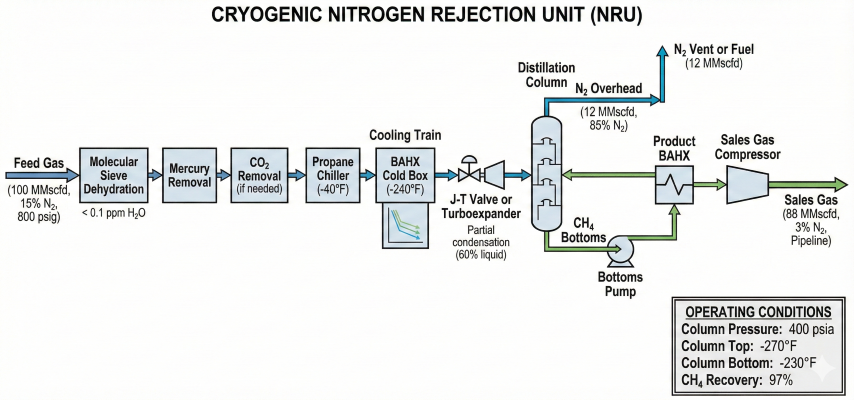
NRU process flow: feed conditioning, cryogenic cooling to -240°F, distillation separates N₂ overhead from CH₄ bottoms product.
Heating value impact
~10 BTU/SCF per 1% N₂
10% N₂ reduces HHV from 1010 to ~900 BTU/SCF (off-spec).
Revenue impact
BTU-based sales
N₂ dilutes energy content, reducing revenue on energy contracts.
LNG constraint
< 1% N₂ required
LNG specs are tight to prevent rollover and flammability issues.
Geological: Nitrogen from air trapped in formations or N₂-rich source rocks. Some reservoirs naturally contain 5-15% N₂ (e.g., Hugoton field, Kansas).
EOR operations: Nitrogen injection for pressure maintenance can contaminate produced gas.
Well operations: N₂ cushion fluid in fracturing or air leaks during workover.
Nitrogen Content by Source
Gas Source
N₂ (mol%)
Treatment
Typical dry gas
0.1-1%
None required
Moderate contamination
3-8%
NRU or membrane if volume justifies
High contamination
10-20%
NRU required for pipeline sales
Extreme (N₂ flood)
>20%
Large NRU; economics marginal
Heating Value Calculation
Effect of Nitrogen on Heating Value:
HHV_mix = Σ (y_i × HHV_i)
Component HHV values (BTU/SCF at 14.73 psia, 60°F):
- Methane (CH₄): 1,010
- Ethane (C₂H₆): 1,769
- Nitrogen (N₂): 0 (inert)
Example - Gas with 10% N₂:
Composition: 88% CH₄, 2% C₂, 10% N₂
HHV = 0.88×10¹⁰ + 0.02×1769 + 0.10×0
HHV = 889 + 35 + 0 = 924 BTU/SCF
Pipeline minimum: 950 BTU/SCF → FAILS
Maximum N₂ for typical gas: ~4-5 mol%
Relative Volatility of N₂/CH₄
The relative volatility (α) determines separation difficulty. Higher α means easier separation but requires colder temperatures.
Temperature (°F)
Column Pressure (psia)
α (N₂/CH₄)
Comment
-280
25
3.6
Very cold; high α, easy separation
-260
35
3.2
High α; fewer stages needed
-220
35
2.8
Typical single-column NRU
-220
150
2.5
Heat-pump assisted column
-220
400
1.8
High-pressure column; more stages needed
Note: α decreases with increasing pressure and increases with decreasing temperature. Single-column NRUs typically operate at 25-50 psia after JT/turboexpander letdown, where α is favorable (2.5-3.5). Double-column designs have an LP column near atmospheric pressure and an HP column at 350-450 psia.
Why cryogenic? N₂ and CH₄ have similar molecular sizes, making them impossible to separate by adsorption or absorption. The only practical methods exploit their different boiling points (cryogenic distillation) or permeabilities (membrane). Cryogenic achieves higher recovery but requires more capital.
2. NRU Process Design
Cryogenic NRUs use distillation at -240 to -280°F to separate nitrogen (overhead) from methane (bottoms). The process requires feed conditioning, multi-stage heat exchange, and careful cold box design.
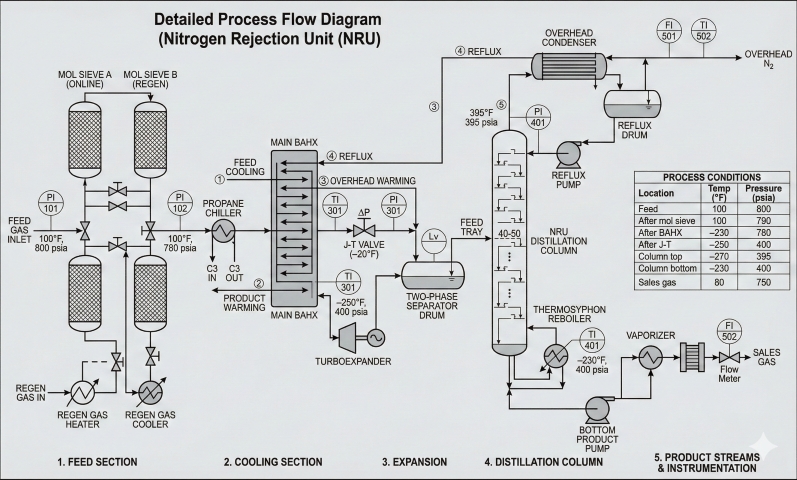
Detailed NRU schematic showing molecular sieve dehydration, multi-stream BAHX, expansion devices, distillation column with reboiler, and product recovery.
Process Steps
Typical NRU Process Sequence:
1. FEED CONDITIONING
- Dehydration to < 0.1 ppmv H₂O (molecular sieve)
- Mercury removal (activated carbon)
- CO₂ removal to < 50 ppm (amine or mol sieve)
- Compression to 400-600 psia
2. COOLING TRAIN
- Ambient → -100°F (propane refrigeration or lean oil)
- -100°F → -240°F (cold process streams in BAHX)
3. PARTIAL CONDENSATION
- J-T expansion or turboexpander
- 50-70% liquid feed to column
4. DISTILLATION
- Feed enters mid-column
- Overhead: 85-98% N₂ (vent or fuel)
- Bottoms: 96-99% CH₄, < 4% N₂ (product)
5. PRODUCT RECOVERY
- Bottoms pumped and vaporized
- Heat exchange with incoming feed
- Recompress from column pressure (~35 psia)
to pipeline pressure (700-800 psia)
- Multi-stage compression required (3-4 stages
at max 3.5:1 ratio per stage)
- Typical: 100-200 HP per MMSCFD of product
Recompression cost: The product exits the column at low pressure (25-50 psia) and must be recompressed to pipeline pressure (700-800+ psia). This multi-stage compression is a major operating cost—typically 100-200 HP per MMSCFD. The compression ratio from 35 psia to 800 psia is ~23:1, requiring 3-4 stages with intercooling.
Operating Conditions
Parameter
Typical Range
Design Basis
Column pressure
25-50 psia
LP column after JT/expander letdown
Bottom temperature
-220 to -240°F
Above CH₄ freezing point
Top temperature
-260 to -280°F
N₂ condensation for reflux
Reflux ratio
0-2 (often zero)
Minimize refrigeration
Theoretical stages
30-60
For > 95% CH₄ recovery at α ≈ 2.8
Feed liquid fraction
50-70%
Optimal V/L balance
Methane Recovery Calculation
Material Balance:
F = D + B (overall)
F × z_CH4 = D × y_D + B × x_B (methane)
Where:
F = Feed rate (mol/h)
D = Distillate (overhead N₂-rich stream)
B = Bottoms (product CH₄-rich stream)
z = Feed composition
y_D = CH₄ in overhead (loss)
x_B = CH₄ in bottoms
Recovery = (B × x_B) / (F × z_CH4) × 100%
Example:
Feed: 100 mol/h, 10% N₂, 88% CH₄
Overhead: 11 mol/h, 85% N₂, 14% CH₄
Bottoms: 89 mol/h, 2% N₂, 96% CH₄
CH₄ recovery = (89 × 0.96) / (100 × 0.88)
= 85.4 / 88.0 = 97.0%
For > 95% recovery:
- 30-50 theoretical stages at α ≈ 2.8
- Overhead CH₄ < 15 mol%
- Bottoms CH₄ > 95 mol%
No-reflux operation: Many NRUs operate without reflux to minimize refrigeration load. This works because α > 2.0 makes separation relatively easy, and the partially condensed feed provides liquid traffic. More trays are needed, but energy savings outweigh tray cost.
3. Distillation Column Sizing
NRU column sizing follows conventional distillation methods with cryogenic material considerations. Column diameter is set by vapor/liquid traffic; height depends on separation requirements.
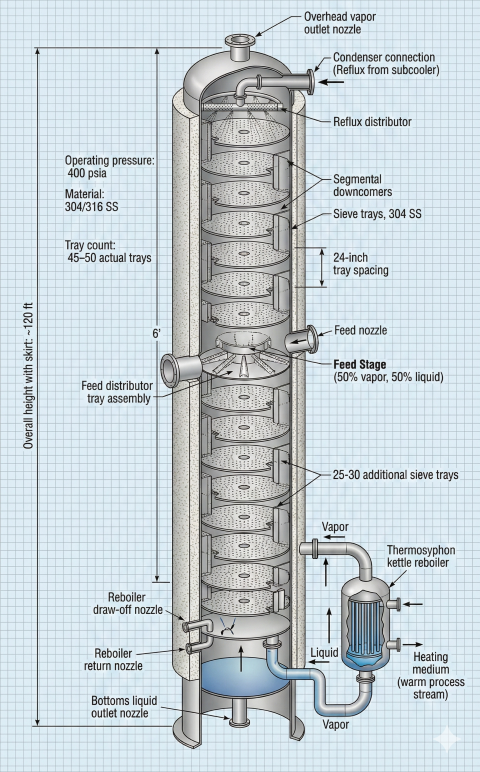
NRU column internals: 45-50 sieve trays, 24" spacing, 304 SS construction, thermosyphon reboiler, ~120 ft total height.
Fair Correlation for Flooding Velocity:
U_flood = C_sb × √[(ρ_L - ρ_V) / ρ_V]
Where:
C_sb = 0.30-0.40 ft/s (24" tray spacing)
ρ_L = Liquid density (lb/ft³)
ρ_V = Vapor density (lb/ft³)
Design velocity: U_design = 0.80 × U_flood
Column area: A = Q_V / U_design
Column diameter: D = √(4A / π)
Example:
Vapor rate: 10 MMscfd overhead at column top
At -220°F, 35 psia (single-column after JT letdown):
ρ_V ≈ 0.25 lb/ft³, ρ_L ≈ 26 lb/ft³
U_flood = 0.35 × √[(26-0.25)/0.25] = 0.35 × 10.1 = 3.55 ft/s
U_design = 0.80 × 3.55 = 2.84 ft/s
Q_V = 10×10⁶ / 86400 × (14.7/35) × (240/520) ≈ 22.5 ft³/s
A = 22.5 / 2.84 = 7.9 ft²
D = √(4×7.9/π) = 3.2 ft
Note: At low column pressure, vapor density is much lower
and volumetric flow is much higher than at feed pressure,
requiring larger diameter columns than feed-pressure
analysis would suggest.
Column Height
Total Column Height:
H_total = H_trays + H_feed + H_ends
For tray columns:
N_actual = N_theoretical / η_tray
H_trays = N_actual × tray_spacing
Where:
η_tray = 60-80% (lower at cryogenic temps)
Tray spacing = 18-24 inches
For structured packing:
H_packing = N_theoretical × HETP
HETP = 2-3 ft for NRU service
Example (tray column):
40 theoretical stages
η_tray = 70%, spacing = 24"
N_actual = 40 / 0.70 = 57 trays
H_trays = 57 × 2 ft = 114 ft
H_ends = 20 ft (nozzles, skirt, vapor space)
H_total = 134 ft
Tray vs Packing Selection
Factor
Sieve/Valve Trays
Structured Packing
Pressure drop
0.1-0.15 psi/tray
0.05-0.10 psi/ft (lower)
Turndown
2:1 to 3:1
4:1 to 5:1 (better)
Capital cost
Lower
Higher
Maintenance
Easier access
Replace entire section
Cryogenic service
Proven, reliable
Lower ΔP saves refrigeration
Materials of Construction
Column shell: 304 or 316 stainless steel (ductile at cryogenic temps)
Trays: 304 SS or aluminum (lightweight, good thermal conductivity)
Insulation: Perlite or polyurethane with vapor barrier
Nozzles: 316 SS with cryogenic flange ratings
Thermal stress: Differential contraction between shell and internals requires expansion joints or flexible supports. Temperature cycling creates significant stress—many NRUs use vacuum-insulated cold boxes.
4. Cryogenic Heat Exchangers
Brazed aluminum plate-fin heat exchangers (BAHX) are the industry standard for NRU cold boxes. They provide high thermal efficiency and compact design but require ultra-clean feed gas.
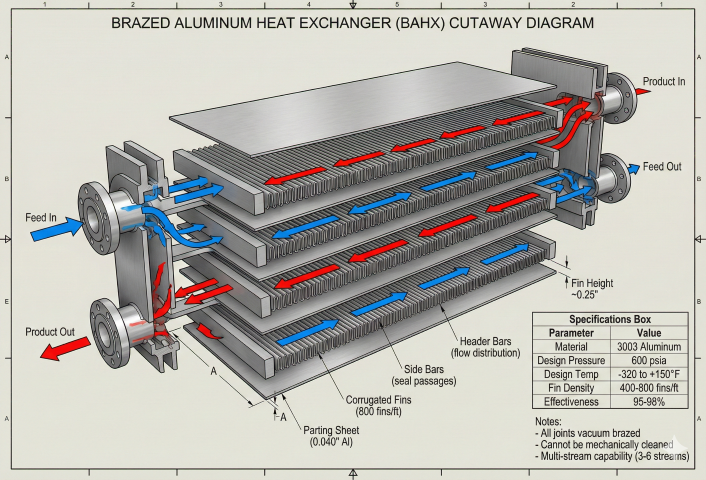
BAHX construction: vacuum-brazed aluminum layers with corrugated fins provide 10× the surface area of shell-tube exchangers in compact design.
BAHX Features
Brazed Aluminum Heat Exchanger Characteristics:
Construction:
- Aluminum plates and corrugated fins brazed in vacuum
- Multi-stream capability (3-6 streams per core)
- Fin density: 400-800 fins/ft²
- Effectiveness: 90-98%
Advantages:
- High UA/volume (10× better than shell-tube)
- Lightweight (1/5 weight of equivalent S&T)
- No gaskets (all brazed construction)
Limitations:
- Cannot be mechanically cleaned
- Requires ultra-clean feed (no solids, mercury)
- Expensive (~$500K-2M for large units)
- Limited pressure (~600-1000 psia)
Heat Duty Calculation
Sensible and Latent Heat:
Q_sensible = ṁ × Cp × ΔT
Q_latent = ṁ × λ × x
Where:
ṁ = Mass flow (lb/hr)
Cp = Specific heat (~0.5 BTU/lb·°F for NG)
ΔT = Temperature change (°F)
λ = Latent heat (~220 BTU/lb for CH₄)
x = Fraction condensed/vaporized
LMTD = (ΔT₁ - ΔT₂) / ln(ΔT₁/ΔT₂)
Required area: A = Q / (U × LMTD)
U typical: 50-150 BTU/hr·ft²·°F for BAHX
Example:
Cool 10 MMscfd from 80°F to -240°F
ṁ ≈ 50,000 lb/hr, Cp = 0.50
Q = 50,000 × 0.50 × 320 = 8 MMBTU/hr
LMTD = 15°F (close approach)
U = 100 BTU/hr·ft²·°F
A = 8,000,000 / (100 × 15) = 5,333 ft²
Minimum Approach Temperature
Service
ΔT_min (°F)
Comment
Warm end (ambient)
10-20
Lower U, larger ΔT acceptable
Mid-temperature
5-10
Good heat transfer
Cryogenic (< -200°F)
3-5
Tight approach critical
Reboiler/condenser
5-15
Phase change allows larger ΔT
Feed Gas Purity Requirements
Contaminant
Limit
Removal Method
Water
< 0.1 ppmv
Molecular sieve or TEG
CO₂
< 50 ppm
Amine or mol sieve
Mercury
< 0.01 μg/Nm³
Activated carbon bed
Particulates
< 1 micron
Coalescer + filter
BAHX reliability: 30+ year design life if feed specs are maintained. Most common failures: plugging from solids/hydrates or mercury attack on aluminum. Once contaminated, BAHX cannot be cleaned—replacement costs $500K-$2M+. Feed conditioning is critical.
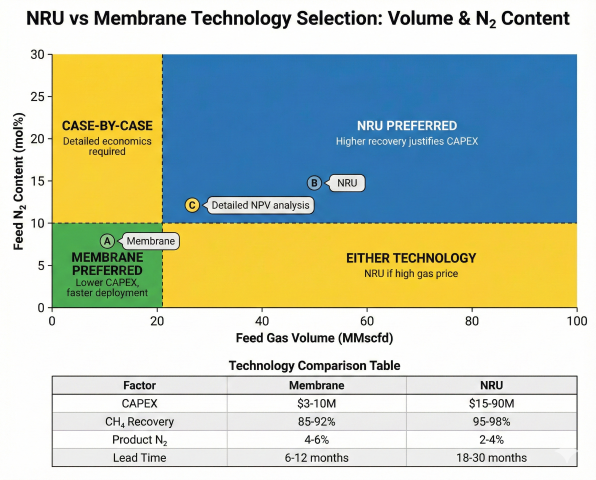
5. NRU vs Membrane Economics
Membrane separation offers lower capital cost but lower methane recovery (85-92% vs 95-98%). The choice depends on gas volume, N₂ content, methane value, and project economics.
NRU vs membrane selection: membrane preferred for smaller volumes and lower N₂; NRU preferred for larger volumes and higher N₂ content where recovery economics justify capital.
Technology Comparison
Factor
Cryogenic NRU
Membrane
CH₄ recovery
95-98%
85-92%
Product N₂
< 2-4 mol%
4-6 mol% (variable)
CAPEX (10 MMscfd)
$15-25 million
$5-10 million
OPEX ($/Mscf)
$0.50-1.00
$0.20-0.50
Footprint
Large
Small (skid-mounted)
Startup time
12-24 hours
Minutes
Turndown
50-100%
20-100%
Life
30-40 years
10-15 years
Selection Criteria
When to Choose Each Technology:
CRYOGENIC NRU preferred when:
- Volume > 20 MMscfd (economies of scale)
- Feed N₂ > 10 mol% (membrane struggles)
- Gas price > $3/Mscf (recovery matters)
- Project life > 20 years
- Pipeline spec < 3% N₂
- NGL recovery integration desired
MEMBRANE preferred when:
- Volume < 20 MMscfd
- Feed N₂ < 10 mol%
- Gas price < $2/Mscf
- Project life < 10 years
- Rapid deployment needed
- Remote location (simpler ops)
BREAKEVEN ANALYSIS:
Lost revenue (membrane) =
(Recovery_NRU - Recovery_mem) × CH₄_feed × Price × 365
Example:
Feed: 10 MMscfd, 88% CH₄
Recovery: NRU 97%, Membrane 90%
Price: $3.00/Mscf
CH₄ loss = 10 × 0.88 × (0.97-0.90) = 0.62 MMscfd
Annual loss = 0.62 × $3.00 × 365 = $679,000/yr
If membrane saves $10M CAPEX:
Payback = $10M / $679K = 14.7 years
At 10% discount rate, 20 years:
PV of loss = $679K × 8.514 = $5.78M
Net membrane savings = $10M - $5.78M = $4.22M
→ Membrane preferred in this case
Typical Project Economics
Capacity
Technology
CAPEX ($MM)
OPEX ($/Mscf)
CH₄ Recovery
5 MMscfd
Membrane
$3-5
$0.30
88-90%
5 MMscfd
NRU
$12-18
$0.80
96-97%
25 MMscfd
Membrane
$8-12
$0.25
89-91%
25 MMscfd
NRU
$25-35
$0.60
97-98%
100 MMscfd
Membrane
$20-30
$0.20
90-92%
100 MMscfd
NRU
$60-90
$0.50
97-98%
Hybrid Configurations
Membrane pre-treatment: Reduce feed N₂ from 15% to 8%, then NRU to final spec. Reduces NRU size and refrigeration.
NRU with membrane polish: Route N₂-rich overhead to membrane for additional CH₄ recovery (squeeze last 1-2%).
Parallel operation: Route high-N₂ feed to NRU, low-N₂ feed to membrane for optimization.
Decision framework: For < 10 MMscfd and < 8% N₂, membrane almost always wins. For > 50 MMscfd and > 12% N₂, NRU is preferred. The 10-50 MMscfd range requires detailed NPV analysis considering gas price, project life, and financing.
Nitrogen is an inert diluent that reduces the heating value of natural gas below pipeline specifications, which typically require a minimum of 950-1000 BTU/scf. Nitrogen rejection units remove excess nitrogen to bring the gas to sales quality.
How does cryogenic distillation separate nitrogen from methane?+
Cryogenic NRUs exploit the difference in boiling points between nitrogen (-320°F) and methane (-259°F) to separate them in a distillation column operating at very low temperatures. The process requires feed gas pre-treatment to remove water, CO₂, and heavy hydrocarbons that would freeze.
What is the Fenske equation used for in NRU design?+
The Fenske equation calculates the minimum number of theoretical stages required for a given separation at total reflux. For NRU design, it uses the relative volatility of nitrogen to methane to establish a baseline stage count before applying actual reflux ratio corrections.
When should membranes be chosen over cryogenic NRU?+
Membranes are preferred for smaller gas volumes, lower nitrogen content, and situations requiring simple operation with minimal infrastructure. Cryogenic NRUs are more economical at larger scales and when high methane recovery and nitrogen purity are required.