Hydrate Formation Temperature: Gas Phase Engineering Fundamentals
Predict hydrate formation conditions using pressure-temperature curves, gas composition analysis, and thermodynamic models to design effective inhibition strategies.
Predict hydrate formation temperature for gas mixtures.
Calculate methanol or glycol injection rates.
Design hydrate prevention systems for pipelines.
1. Overview & Applications
Gas hydrates are ice-like crystalline solids formed when water molecules trap light hydrocarbon molecules under high pressure and low temperature. Critical concern for:
Hydrate: Clathrate structure where water cages trap guest molecules (CH₄, C₂H₆, C₃H₈, CO₂, H₂S)
Formation temperature (T_hyd): Temperature below which hydrates form at given pressure
Hydrate curve: P-T line separating stable hydrate region from hydrate-free region
Subcooling: Difference between operating temperature and hydrate temperature (T_op - T_hyd)
Inhibitor: Chemical that shifts hydrate curve to lower temperature (methanol, glycol, salts)
Why hydrate prediction matters: Hydrate formation is one of the most common and costly flow assurance problems. A single hydrate blockage can cost $1M-$10M in lost production, remediation, and equipment damage. Accurate prediction and prevention are essential for reliable operations.
Hydrate Formation Conditions
Three conditions must be present simultaneously for hydrates to form:
Condition
Requirement
Typical Value
Free water present
Liquid water phase (not just water vapor)
Any amount (even droplets)
Sufficient pressure
Pressure above hydrate formation pressure
> 150-300 psia (depends on T and gas composition)
Low temperature
Temperature below hydrate formation temperature
< 32-80°F (depends on P and gas composition)
Hydrate-forming gas
CH₄, C₂H₆, C₃H₈, CO₂, H₂S, etc.
Natural gas, acid gas
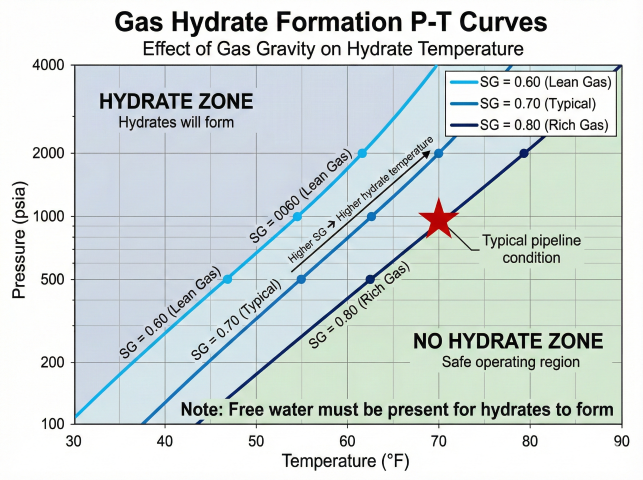
Hydrate Formation Temperature vs. Pressure
Pressure (psia)
Pure Methane (T_hyd)
Natural Gas 0.6 SG (T_hyd)
Natural Gas 0.7 SG (T_hyd)
100
32°F
34°F
36°F
300
42°F
48°F
52°F
500
48°F
56°F
61°F
1,000
58°F
62°F
66°F
1,500
64°F
68°F
71°F
2,000
68°F
72°F
74°F
Note: Higher specific gravity gas (more C₂+ components) forms hydrates at higher temperature.
Gas hydrate formation P-T curves showing effect of gas gravity on hydrate temperature (higher SG = higher hydrate temperature)
Common Hydrate Scenarios
Wellhead choke: JT expansion cools gas below hydrate temperature, free water from formation condenses and forms hydrates
Gas pipeline: Ground temperature (40-55°F) below hydrate curve at operating pressure, condensed water forms hydrates in low spots
Offshore platform: Seawater cooling (40-60°F) brings process streams into hydrate region
Gas plant inlet: Ambient cooling of high-pressure gas, water knock-out insufficient
Compressor aftercooler: Cooling to 100-120°F at discharge pressure still in hydrate region for high-pressure systems
Turboexpander: Refrigeration by expansion can reach -40°F+, severe hydrate risk without dehydration
2. Hydrate Chemistry & Crystal Structure
Understanding hydrate molecular structure explains formation behavior and inhibition mechanisms.
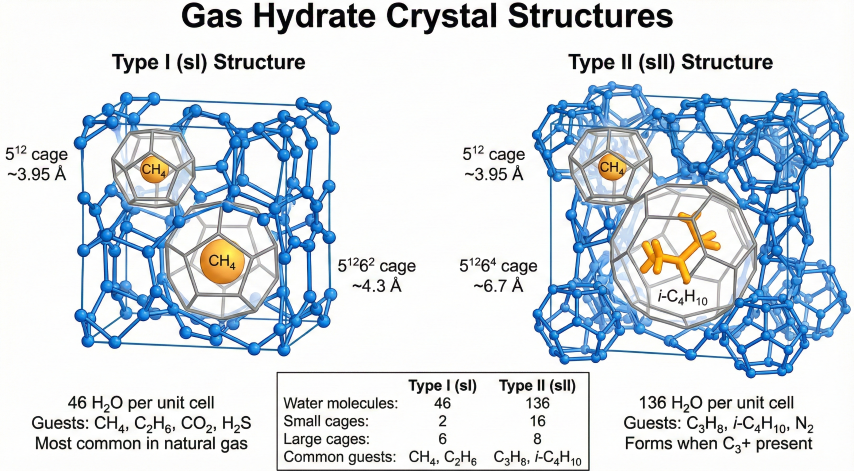
Clathrate Structure
Hydrate Crystal Structures:
Type I (sI) hydrate:
- Water cage: 46 water molecules form unit cell
- Guest molecules: Methane, ethane, H₂S, CO₂
- Cavity size: 3.95-4.3 Å diameter
- Stoichiometry: Typically 5.75 H₂O per guest molecule (CH₄·5.75H₂O)
- Most common in natural gas systems
Type II (sII) hydrate:
- Water cage: 136 water molecules form unit cell
- Guest molecules: Propane, isobutane, nitrogen
- Cavity size: 4.73-6.73 Å diameter
- Stoichiometry: Typically 17 H₂O per guest molecule
- Forms when C₃+ components present in gas
Type H (sH) hydrate:
- Rare, requires large molecules (neohexane, methylcyclohexane)
- Not typically encountered in natural gas systems
Hydrate number (n):
n = moles H₂O / moles hydrocarbon
Typical values:
Pure methane: n = 5.75-6.0
Natural gas: n = 6.0-7.0 (varies with composition)
Volume expansion:
Hydrate density: 0.9-1.0 g/cm³ (close to ice)
Volume expansion: Water → Hydrate causes 20-30% volume increase
This expansion force can rupture pipes, valves, fittings
Type I (sI) and Type II (sII) gas hydrate clathrate structures with cage geometries and common guest molecules
Hydrate Formation Kinetics
Nucleation and Growth:
Hydrate formation is multi-step process:
1. Cooling below hydrate temperature (thermodynamic driving force)
2. Nucleation (formation of stable hydrate crystal nucleus)
- Induction time: Minutes to hours (stochastic process)
- Requires subcooling: Typically 5-15°F below T_hyd
3. Crystal growth (mass transfer limited)
- Rapid growth once nucleation occurs
- Can plug pipeline in minutes to hours
4. Agglomeration (crystals stick together)
- Forms solid plug
Subcooling effect:
Subcooling = T_hyd - T_actual
Small subcooling (1-5°F):
- Long induction time (hours to days)
- Slow growth rate
- May not form plug (crystals stay dispersed)
Large subcooling (> 10°F):
- Short induction time (minutes)
- Rapid growth
- High plug risk
Kinetic inhibitors (KHI):
- Delay nucleation (extend induction time)
- Do not change T_hyd (not thermodynamic)
- Allow operation 5-15°F below T_hyd without plugging
- Limited application (low subcooling, limited hold time)
Anti-agglomerants (AA):
- Prevent crystal agglomeration
- Hydrates still form but stay dispersed (transportable slurry)
- Oil-continuous systems (not water-continuous)
Gas Composition Effects
Component
Effect on T_hyd
Hydrate Structure
Notes
Methane (CH₄)
Baseline
sI
Primary hydrate former in natural gas
Ethane (C₂H₆)
+3-5°F higher T_hyd
sI
Increases hydrate temperature moderately
Propane (C₃H₈)
+5-10°F higher T_hyd
sII
Significantly increases hydrate risk
Isobutane (i-C₄H₁₀)
+8-12°F higher T_hyd
sII
Strong hydrate promoter
n-Butane (n-C₄H₁₀)
+10-15°F higher T_hyd
sII
Very strong promoter, limited solubility
Carbon dioxide (CO₂)
+5-8°F higher T_hyd
sI
Acid gas, common in natural gas
Hydrogen sulfide (H₂S)
+3-6°F higher T_hyd
sI
Sour gas component
Nitrogen (N₂)
-5-10°F lower T_hyd
sII (weak former)
Hydrate inhibitor, dilutes gas
Pentanes+ (C₅+)
No direct effect
Too large for cages
Do not form hydrates, but liquid phase affects water activity
Water Activity and Salinity
Water Activity Effect:
Water activity (a_w):
a_w = vapor pressure of solution / vapor pressure of pure water
For hydrate formation:
Hydrate formation requires high water activity (a_w > 0.7-0.8)
Salinity depression:
Dissolved salts (NaCl, CaCl₂) reduce water activity
Lower water activity → lower hydrate formation temperature
Typical depression:
1 wt% NaCl: ΔT_hyd ≈ -0.8°F
3 wt% NaCl (seawater): ΔT_hyd ≈ -2.5°F
10 wt% NaCl (brine): ΔT_hyd ≈ -10°F
23 wt% NaCl (saturated): ΔT_hyd ≈ -26°F
Comparison:
Salt is permanent inhibitor (does not evaporate)
Less effective per weight % than methanol or glycol
Corrosion concern in pipelines
Used in drilling fluids, subsea systems
Glycol (MEG/TEG) in water:
Also reduces water activity
10 wt% MEG: ΔT_hyd ≈ -4-5°F
20 wt% MEG: ΔT_hyd ≈ -10-12°F
Higher concentrations more effective (see Section 4)
Rich gas risk: Natural gas with C₃+ components (> 3% propane, > 1% butanes) forms hydrates at significantly higher temperature than lean gas. A "rich" gas (SG = 0.75-0.85) may form hydrates at 70-75°F at 1,000 psia, compared to 60-65°F for lean gas (SG = 0.6). Always account for heavy ends in hydrate prediction.
3. Hydrate Formation Temperature Prediction
Multiple methods exist for predicting hydrate formation conditions, from simple charts to rigorous thermodynamic models.
Gas Gravity Method (Hand Calculation)
Motiee (1991) Correlation - Industry Standard:
For natural gas with known specific gravity (γ):
T_hyd (°F) = A₀ + A₁·log₁₀(P) + A₂·[log₁₀(P)]² + B₁·γ + B₂·γ² + C₁·γ·log₁₀(P)
Where:
T_hyd = Hydrate formation temperature (°F, directly)
P = Pressure (psia)
γ = Gas specific gravity (Air = 1.0)
Coefficients (Motiee 1991, °F output):
A₀ = -238.24469 A₁ = +78.99181 A₂ = -5.352544
B₁ = +349.47324 B₂ = -150.85396 C₁ = -27.604065
Valid Range:
Pressure: 100 - 4,000 psia
Gas gravity: 0.55 - 0.90
Quick Reference Values (GPSA Charts):
At 1,000 psia:
γ = 0.60: T_hyd ≈ 62°F (17°C)
γ = 0.65: T_hyd ≈ 64°F (18°C)
γ = 0.70: T_hyd ≈ 66°F (19°C)
γ = 0.80: T_hyd ≈ 71°F (22°C)
Accuracy: tends to UNDER-predict ~3-7°F vs GPSA charts (apply safety margin)
Reference: Motiee M (1991) "Estimate possibility of hydrates"
Hydrocarbon Processing, 70:98-99
K-Value Method (Component-Based)
Katz Correlation (Classic Method):
For gas with known composition:
Step 1: Calculate pseudo-reduced properties
P_r = P / P_pc
T_r = T / T_pc
Where:
P_pc = Σ(y_i × P_ci) (mole-weighted sum of critical pressures)
T_pc = Σ(y_i × T_ci) (mole-weighted sum of critical temperatures)
Step 2: Use Katz chart (hydrate formation curve)
Read T_hyd at given P and gas gravity
Step 3: Apply correction for gas composition
If CO₂ > 5%: T_hyd increases ~1°F per 1% CO₂
If H₂S > 5%: T_hyd increases ~0.8°F per 1% H₂S
If N₂ > 5%: T_hyd decreases ~0.5°F per 1% N₂
Example gas composition:
Component | Mole % | T_c (°R) | P_c (psia)
C₁ | 85.0 | 343.1 | 666.4
C₂ | 8.0 | 549.6 | 706.5
C₃ | 4.0 | 665.7 | 616.0
C₄ | 2.0 | 765.2 | 550.6
C₅+ | 0.5 | 913.0 | 488.6
CO₂ | 0.5 | 547.5 | 1,071
T_pc = 0.85×343.1 + 0.08×549.6 + 0.04×665.7 + 0.02×765.2 + 0.005×913.0 + 0.005×547.5
T_pc = 291.6 + 44.0 + 26.6 + 15.3 + 4.6 + 2.7 = 384.8°R
P_pc = 0.85×666.4 + 0.08×706.5 + 0.04×616.0 + 0.02×550.6 + 0.005×488.6 + 0.005×1,071
P_pc = 566.4 + 56.5 + 24.6 + 11.0 + 2.4 + 5.4 = 666.3 psia
At P = 1,000 psia:
P_r = 1,000 / 666.3 = 1.50
From Katz chart at P_r = 1.50: T_hyd ≈ 65-68°F
This method is more accurate than gas gravity alone.
CSMGem / PVTsim (Rigorous Models)
Thermodynamic Modeling Software:
Commercial packages for accurate hydrate prediction:
1. CSMGem (Colorado School of Mines):
- Van der Waals-Platteeuw model
- Rigorous thermodynamic treatment
- Accuracy: ±1-2°F
- Input: Full gas composition (C₁-C₁₀+, N₂, CO₂, H₂S)
2. PVTsim (Calsep):
- Cubic equation of state (PR, SRK)
- Phase behavior + hydrate prediction
- Integrated with process simulation
3. HYSYS / Aspen Plus:
- Process simulation with hydrate package
- Predicts hydrate formation in flowsheet
4. OLGA (Schlumberger):
- Transient multiphase flow simulation
- Hydrate kinetics modeling
- Used for offshore pipeline design
Typical workflow:
1. Input gas composition (detailed GC analysis)
2. Specify pressure and temperature range
3. Calculate hydrate formation curve (P-T envelope)
4. Identify operating conditions relative to hydrate curve
5. Design margin: Operate 10-20°F above T_hyd or use inhibitor
Accuracy comparison:
Hand calculations (SG method): ±10-15°F
Katz chart: ±5-10°F
CSMGem / PVTsim: ±1-2°F
For critical applications (subsea, arctic, high-pressure):
Always use rigorous modeling, not hand calculations.
Hydrate Pressure-Temperature Curves
Gas Type
500 psia
1,000 psia
1,500 psia
2,000 psia
Pure methane
48°F
58°F
64°F
68°F
Lean gas (SG 0.6)
52°F
62°F
68°F
72°F
Typical gas (SG 0.7)
58°F
66°F
71°F
74°F
Rich gas (SG 0.8)
64°F
71°F
75°F
78°F
Propane-rich (10% C₃)
68°F
75°F
79°F
82°F
Hydrate Locus (P-T Diagram)
Interpreting Hydrate P-T Envelope:
P-T diagram shows:
- Horizontal axis: Temperature (°F)
- Vertical axis: Pressure (psia)
- Hydrate curve: Boundary between hydrate-free and hydrate zones
Zones:
Above and left of curve: Hydrate zone (T too low, P too high)
Below and right of curve: Hydrate-free zone (safe operation)
Example:
Operating point: 1,000 psia, 40°F
Hydrate curve: 1,000 psia, 66°F
Subcooling: 66 - 40 = 26°F (severe hydrate risk!)
Safe operation:
Option 1: Increase temperature above 66°F (heating, insulation)
Option 2: Reduce pressure below hydrate curve (depressurize)
Option 3: Inject inhibitor to shift curve left (lower T_hyd)
Option 4: Remove free water (dehydration)
Design margin:
Typical: Operate 10-15°F above T_hyd (T_op ≥ T_hyd + 10°F)
Conservative: 20-30°F margin for critical systems
Arctic: 40°F+ margin due to extreme cold
Transient conditions:
Startup, shutdown, flow rate changes can transiently enter hydrate zone
Must analyze transient temperature profile (OLGA modeling)
May require temporary inhibitor injection during transients
Design philosophy: Never design pipeline to operate continuously in hydrate region, even with inhibitor. Inhibitor system failures (pump trip, chemical shortage, dilution by water influx) will cause immediate hydrate formation. Design margin ensures safe operation even with inhibitor system upset.
4. Thermodynamic Hydrate Inhibition
Thermodynamic inhibitors depress hydrate formation temperature by reducing water activity, allowing operation below uninhibited hydrate curve.
Methanol Injection
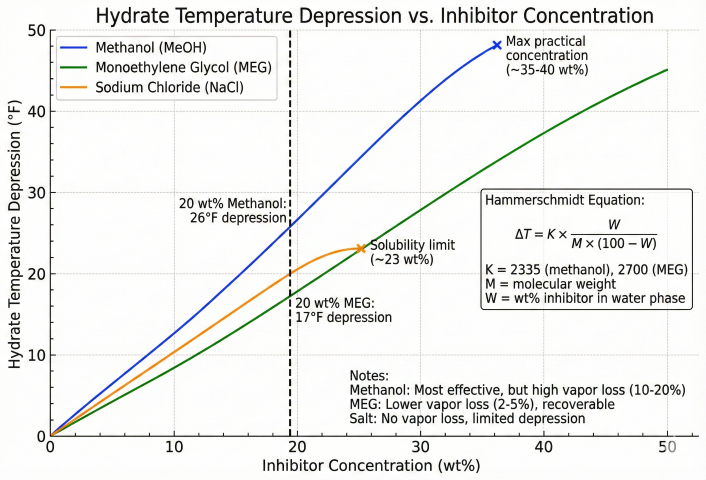
Methanol (MeOH) Hydrate Depression:
Hammerschmidt equation:
ΔT_hyd = (K_H × W) / (100 × MW_inhibitor - W × MW_inhibitor)
Where:
ΔT_hyd = Hydrate depression (°F)
K_H = Hammerschmidt constant (2,335 for methanol)
W = Weight % inhibitor in water phase (not in gas)
MW_inhibitor = Molecular weight (32 for methanol, 62 for MEG, 150 for TEG)
Simplified for methanol:
ΔT_hyd ≈ 72 × W / (100 - W)
Example:
Required depression: 20°F
Solve for W:
20 = 72 × W / (100 - W)
20 × (100 - W) = 72 × W
2,000 - 20W = 72W
2,000 = 92W
W = 21.7 wt% methanol in water phase
Methanol injection rate:
Q_MeOH = (Q_water × W × (100 + W_vap)) / ((100 - W) × (100 - W_MeOH))
Where:
Q_MeOH = Methanol injection rate (gal/day)
Q_water = Water production rate (gal/day)
W = Required wt% in water (21.7%)
W_vap = Methanol lost to vapor phase (typically 5-15%)
W_MeOH = Purity of injected methanol (typically 100%)
Example:
Water production: 100 bbl/day = 4,200 gal/day
Required: 21.7 wt%
Vapor loss: 10%
Methanol purity: 100%
Q_MeOH = (4,200 × 21.7 × 110) / ((100 - 21.7) × 100)
Q_MeOH = (4,200 × 21.7 × 110) / 7,830
Q_MeOH = 10,033,800 / 7,830
Q_MeOH = 1,281 gal/day (30.5 bbl/day)
Cost:
Methanol: $3-5/gallon
Cost: 1,281 gal/day × $4/gal = $5,124/day = $1.87M/year
Methanol recovery:
Install methanol distillation unit (still)
Recovers 80-95% of methanol from produced water
Reduces operating cost to $0.2-0.4M/year (makeup only)
Capital cost: $500k-2M for 100 bbl/day unit
Payback: 6-24 months
Glycol Injection (MEG/DEG/TEG)
Ethylene Glycol (MEG) Hydrate Depression:
Hammerschmidt equation for MEG:
ΔT_hyd = 2,335 × W / (100 × 62 - 62 × W)
ΔT_hyd ≈ 37.7 × W / (100 - W)
For same 20°F depression:
20 = 37.7 × W / (100 - W)
W = 34.7 wt% MEG in water
Comparison to methanol:
Methanol: 21.7 wt% for 20°F depression
MEG: 36.0 wt% for 20°F depression
→ MEG requires higher concentration (heavier, more expensive to inject)
MEG advantages:
- Higher boiling point (387°F vs. 148°F for methanol)
- Less vapor loss (2-5% vs. 10-20% for methanol)
- Less flammable (flash point 232°F vs. 52°F)
- Recoverable by distillation (85-95% recovery typical)
MEG disadvantages:
- Higher viscosity (affects injection, pumping)
- More expensive ($/gallon basis)
- Degradation products (organic acids) cause corrosion
Diethylene glycol (DEG):
Intermediate between MEG and TEG
Depression: ~40 × W / (100 - W)
Triethylene glycol (TEG):
Primarily used for dehydration, not hydrate inhibition
Lower depression per weight %
Depression: ~50 × W / (100 - W)
Hydrate temperature depression vs. inhibitor concentration comparing methanol, MEG, and NaCl effectiveness
Inhibitor Injection Point Design
Injection System Design:
Injection location:
- Upstream of hydrate formation zone
- Allow mixing length for distribution
- Typical: 10-50 pipe diameters upstream
Atomization nozzle:
- Spray pattern: Full cone, hollow cone
- Droplet size: < 100 microns (better mixing)
- Injection pressure: 50-100 psi above line pressure
Number of injection points:
Single point: Adequate if gas velocity > 20 ft/s (turbulent mixing)
Multiple points: Required for low velocity (< 10 ft/s) or large diameter (> 24")
Injection rate calculation:
Q_inj (gpm) = (Q_water × SG_water × W) / (SG_inhibitor × (100 - W) × 60 × 7.48)
Example - 100 bbl/day water, 22 wt% methanol:
Q_inj = (100 × 42 gal/bbl × 1.0 × 22) / (0.79 × 78 × 1,440)
Q_inj = 92,400 / 87,091
Q_inj = 1.06 gpm average
Pump sizing:
- Typical: Positive displacement (diaphragm or piston)
- Flow range: 0.1-10 gpm (turndown ratio 100:1)
- Pressure: Line pressure + 50-100 psi
- Redundancy: 2×100% pumps (duty + standby)
- Controls: Flow control valve, stroke adjustment
Storage:
Tank size: 5-10 days supply typical
1.06 gpm × 1,440 min/day × 7 days = 10,685 gal = 254 bbl
Use 300 bbl tank (with ullage)
Monitoring:
- Injection flow rate (flow meter)
- Tank level (prevent run-out)
- Pump discharge pressure (detect plugging)
- Low-low level alarm (shutdown before empty)
Salt (NaCl, CaCl₂) Inhibition
Salt Type
Concentration (wt%)
Hydrate Depression (°F)
Application
Sodium chloride (NaCl)
3% (seawater)
2-3°F
Natural inhibition in offshore systems
NaCl
10%
8-10°F
Brine systems
NaCl
23% (saturated)
20-25°F
Maximum achievable with NaCl
Calcium chloride (CaCl₂)
10%
12-15°F
Drilling fluids, more effective than NaCl
CaCl₂
20%
28-32°F
Heavy brine, completion fluids
CaCl₂
30% (near saturation)
45-50°F
Maximum depression with CaCl₂
Inhibitor Selection Criteria
Inhibitor
Cost
Vapor Loss
Corrosivity
Recoverability
Best Use
Methanol
Low
High (10-20%)
Low
Good (distillation)
Short-term, high vapor loss acceptable
MEG
Moderate
Low (2-5%)
Moderate (degradation)
Excellent (distillation)
Long-term, continuous injection with recovery
DEG
High
Very low
Moderate
Good
Specialty applications
Salt
Very low
None
High
Not recoverable
Formation water (naturally present)
Methanol vs. MEG decision: Use methanol for: (1) Short-term/intermittent injection, (2) Small water rates (<50 bbl/day), (3) No recovery system. Use MEG for: (1) Continuous injection > 6 months, (2) Large water rates (>100 bbl/day), (3) MEG recovery economically justified. Crossover typically at 50-100 bbl/day water production.
5. Hydrate Prevention Strategies
Multiple strategies prevent hydrate formation, each with specific applications and economic considerations.
Strategy 1: Remove Free Water (Dehydration)
Gas Dehydration to Prevent Hydrates:
Water specification:
Pipeline quality gas: 7 lb H₂O / MMscf (typical)
Equivalent dewpoint: -20°F to -40°F at 1,000 psia
Dehydration methods:
1. Glycol dehydration (TEG contactor)
- Achieves: 1-7 lb/MMscf
- Capital cost: $200k-$1M for 10-50 MMscfd
- Operating cost: $50k-200k/year (glycol makeup, fuel gas)
2. Molecular sieve dehydration
- Achieves: < 1 lb/MMscf (0.1 lb/MMscf possible)
- Ultra-dry gas (dewpoint -100°F+)
- Capital cost: $500k-$3M for 10-50 MMscfd
- Used for LNG, cryogenic plants
3. Refrigeration + separator
- Cool gas to condense water
- Achieves: 7-20 lb/MMscf (moderate)
- Capital cost: $300k-$1.5M
- Combined with hydrocarbon recovery (NGL extraction)
Effectiveness:
If water content < 7 lb/MMscf and operating above dewpoint:
→ No free water present
→ Hydrates cannot form (even if in hydrate P-T zone)
Best applications:
- Processing plants (upstream of pipeline)
- Wellhead treatment (before gathering)
- Compressor stations (protect downstream line)
Limitations:
- Does not protect against water influx (e.g., pipeline low spots collect condensed water)
- Requires periodic verification (dewpoint testing)
Strategy 2: Keep Temperature Above Hydrate Curve
Heating and Insulation:
Heating methods:
1. Heat tracing (electric or steam)
- Maintains temperature above hydrate point
- Typical: Operate 10-20°F above T_hyd
- Cost: $20-50/ft installed for electric trace
- Power: 5-15 watts/ft
2. Line heaters (fired or electric)
- Inline heat exchanger
- Heats gas to 100-150°F
- Duty: 0.5-5 MMBtu/hr typical
- Capital cost: $50k-300k per heater
3. Bundle insulation (subsea)
- Pipe-in-pipe with insulation annulus
- Maintains temperature for hours during shutdown
- Cost: $500-2,000/ft installed (subsea)
Insulation:
- Reduces heat loss, extends cool-down time
- Typical: 2-4 inches polyurethane foam or mineral wool
- Cost: $10-30/ft installed
- R-value: 4-8 hr·ft²·°F/Btu per inch
Cool-down time calculation:
t_cooldown = (m × Cp × ΔT) / (U × A × ΔT_log_mean)
Where:
t_cooldown = Time to reach hydrate temperature (hours)
m = Mass of gas in pipeline (lb)
Cp = Specific heat of gas (Btu/lb·°F)
U = Overall heat transfer coefficient (Btu/hr·ft²·°F)
A = Pipe external surface area (ft²)
Example - Insulated buried pipeline:
Length: 10 miles
Diameter: 12"
Operating: 80°F
Hydrate temperature: 66°F
Ground temperature: 50°F
Insulation: 2" polyurethane (U = 0.15 Btu/hr·ft²·°F)
Cool-down time ≈ 24-48 hours (provides operational buffer)
Application:
Shutdown/startup protection (pipeline stays warm long enough to restart before hydrates form)
Strategy 3: Operate Above Hydrate Pressure
Pressure Reduction:
Concept:
Lower operating pressure below hydrate formation pressure at ambient temperature.
Example:
Ambient temperature: 40°F (ground temperature)
From hydrate curve: At 40°F, hydrates form at P > 250 psia
If operate at P = 200 psia: Below hydrate curve → No hydrates
Limitation:
Low pressure → low throughput (capacity limited)
Q ∝ √(P₁² - P₂²) (gas flow equation)
Halving pressure = 29% reduction in capacity (not acceptable for most pipelines)
Application:
- Low-pressure gathering systems (100-300 psia)
- Distribution systems (typically < 100 psia, well below hydrate pressure)
- Temporary operation during shutdown/depressurization
Strategy 4: Chemical Inhibition (Thermodynamic)
Covered in Section 4. Summary:
Methanol: 10-30 wt% provides 10-30°F depression
MEG: 20-50 wt% provides 10-30°F depression
Continuous injection required (cannot stop)
Cost: $0.5-5M/year depending on water rate and recovery
Strategy 5: Kinetic Inhibition (KHI)
Kinetic Hydrate Inhibitors:
Mechanism:
- Delay hydrate nucleation (do not shift T_hyd)
- Allow operation 5-15°F below T_hyd
- Low dosage: 0.5-3 wt% in water phase (vs. 20-30% for methanol)
Common KHIs:
- PVP (polyvinylpyrrolidone)
- PVCap (polyvinylcaprolactam)
- Polymers with pendant groups
Limitations:
- Subcooling limit: Max 10-15°F below T_hyd
- Hold time: 24-72 hours typical (not indefinite)
- Pressure limit: < 1,500-2,000 psia
- Does not work for CO₂, H₂S (acid gases)
Application:
- Subsea tiebacks (short cooldown time)
- Transient protection (startup/shutdown)
- Low water cut systems (< 30% water)
Cost:
- Chemical: $10-30/gallon (expensive)
- Dosage: 0.5-2% of water → $0.5-2M/year for 100 bbl/day water
- No recovery (single-pass)
Decision:
Use KHI if:
- Subcooling < 10°F
- Hold time < 48 hours
- Low water cut
- Cannot tolerate high dosage (equipment size constraints)
Use methanol/MEG if:
- Subcooling > 15°F
- Continuous operation
- High water cut
- Cost-effective with recovery
Strategy 6: Anti-Agglomerants (AA)
Anti-Agglomerant Technology:
Mechanism:
- Allow hydrates to form
- Prevent agglomeration (crystals dispersed)
- Gas + oil + water + AA = transportable slurry
Requirements:
- Oil-continuous system (water droplets in oil)
- Water cut < 50% (preferably < 30%)
- Sufficient liquid velocity (prevent settling)
Dosage:
- 0.5-3 wt% based on water phase
- Similar to KHI dosage
Limitations:
- Does not work in water-continuous systems
- Requires oil phase (> 10% liquid hydrocarbon)
- Pipeline must have velocity > 3 ft/s (prevent settling)
- Not suitable for gas-only pipelines
Application:
- Subsea oil production flowlines
- Multiphase pipelines (oil + water + gas)
Advantages:
- Lower dosage than thermodynamic inhibitors
- Allows hydrates to form (no need to prevent)
- Cold flow technology (no heating required)
Cost:
Similar to KHI ($0.5-2M/year for 100 bbl/day water)
Economic Comparison
Strategy
Capital Cost
Operating Cost/Year
Best Application
Dehydration (TEG)
$500k-$2M
$100k-$500k
Gas plants, large facilities
Methanol injection
$50k-$200k
$0.5-$3M
Small water rates, short-term
MEG + recovery
$500k-$3M
$200k-$1M
Large water rates, long-term
Heating (electric trace)
$200k-$1M (10 miles)
$50k-$300k (power)
Short lines, available power
Insulation
$100k-$500k (10 miles)
$0
Buried lines, cool-down protection
KHI injection
$50k-$150k
$0.5-$2M
Subsea, low subcooling
Anti-agglomerants
$50k-$150k
$0.5-$2M
Oil flowlines, multiphase
Defense in depth: Best practice combines multiple strategies: (1) Dehydration to minimize free water, (2) Insulation to extend cool-down time, (3) Methanol/MEG injection as backup during upsets, (4) Operating procedures to avoid hydrate zone during startup/shutdown. No single strategy is 100% reliable; layered protection ensures safe operations.
How does gas composition affect hydrate formation temperature?+
Heavier hydrocarbons like ethane and propane form hydrates at higher temperatures than pure methane, meaning richer gas compositions shift the hydrate curve to higher temperatures. CO₂ and H₂S also raise the hydrate formation temperature compared to a pure methane system.
What is a hydrate pressure-temperature curve?+
A hydrate P-T curve plots the equilibrium conditions where hydrates form as a function of pressure and temperature for a given gas composition. Operating conditions to the left of this curve (lower temperature or higher pressure) indicate hydrate risk.
What are the main hydrate prevention strategies in gas processing?+
The main strategies include removing free water through dehydration, maintaining operating temperature above the hydrate curve, chemical inhibition with thermodynamic inhibitors like methanol or MEG, and using kinetic inhibitors or anti-agglomerants for subsea applications.
How do salts like NaCl and CaCl₂ affect hydrate formation?+
Dissolved salts act as thermodynamic inhibitors by reducing water activity, which depresses the hydrate formation temperature. CaCl₂ provides greater depression per unit weight than NaCl and is sometimes used in completion and workover fluids for hydrate control.