Calculate and optimize pipeline operating expenses including fuel costs, maintenance, labor, utilities, and life cycle costing for accurate project economics and tariff design.
Operating expenses (OPEX) are the recurring costs required to operate and maintain pipeline systems. OPEX directly impacts project economics, tariff design, and profitability over the asset lifecycle.
Fuel/energy costs
Largest OPEX component
Compressor fuel typically 40-60% of total operating costs for gas pipelines.
Why OPEX matters: Operating costs occur every year over 20-40 year asset life. Total lifecycle OPEX often equals or exceeds initial capital cost (CAPEX). Accurate OPEX estimation critical for tariff design, NPV analysis, and competitive positioning.
OPEX vs. CAPEX
Aspect
OPEX (Operating Expense)
CAPEX (Capital Expense)
Definition
Recurring costs to operate asset
One-time cost to acquire/build asset
Frequency
Annual, continuous
Upfront, periodic major upgrades
Accounting
Expensed in year incurred
Capitalized, depreciated over life
Tax treatment
Fully deductible as expense
Depreciation deduction over time
NPV impact
Negative cash flow each year
Large negative cash flow Year 0
Examples
Fuel, labor, parts, utilities
Pipeline, compressors, facilities
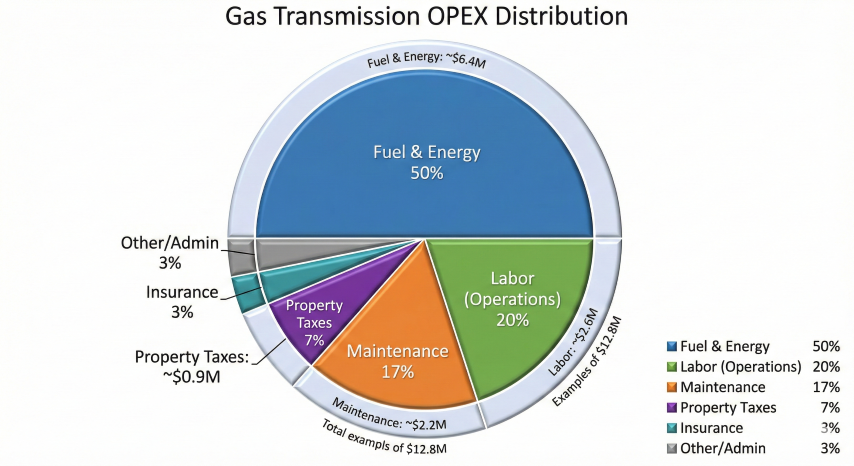
Typical OPEX Breakdown - Gas Transmission
Typical gas transmission pipeline OPEX distribution showing fuel costs as the dominant expense category
Cost Category
Percent of Total OPEX
Typical Range
Fuel & energy
40-60%
Highly variable with gas prices
Labor (operations)
15-25%
Depends on automation level
Maintenance (labor + materials)
15-20%
Increases with asset age
Property taxes
5-10%
Based on assessed value
Insurance
2-5%
Coverage type and limits
Integrity management
3-8%
ILI runs, repairs, monitoring
Utilities & other
2-5%
Communications, minor expenses
Administrative overhead
3-7%
Allocated corporate costs
OPEX Benchmarks by Pipeline Type
Pipeline Type
Annual OPEX per Mile
OPEX per Unit Throughput
Key Cost Drivers
Transmission (large diameter)
$10,000-$30,000/mile
$0.10-$0.25/Mcf
Compression fuel, automation
Transmission (small diameter)
$8,000-$20,000/mile
$0.15-$0.35/Mcf
Lower volumes, higher unit cost
Gathering system
$5,000-$15,000/mile
$0.20-$0.50/Mcf
Multiple laterals, field ops
Distribution (urban)
$15,000-$40,000/mile
$1.00-$3.00/Mcf
Leak surveys, emergency response
Liquids (crude/products)
$8,000-$25,000/mile
$0.50-$2.00/bbl
Pumping power, batch tracking
2. Fuel Costs
Compressor fuel is typically the largest operating expense for gas transmission pipelines, ranging from 40-60% of total OPEX. Fuel costs driven by compression horsepower, runtime, fuel efficiency, and gas prices.
Compressor Fuel Consumption
Fuel Gas Consumption (Reciprocating Engine):
Q_fuel = HP × BSFC × Hours
Where:
Q_fuel = Fuel consumption (scf or Mcf)
HP = Brake horsepower (bhp)
BSFC = Brake specific fuel consumption (scf/hp-hr)
Hours = Operating hours
Typical BSFC values:
- Reciprocating engine: 7.0-8.5 scf/hp-hr
- Gas turbine: 9.0-11.0 scf/hp-hr (lower efficiency)
- Electric motor: N/A (uses electricity)
Example: 5,000 hp compressor, 8760 hr/yr, BSFC = 7.5 scf/hp-hr
Q_fuel = 5,000 × 7.5 × 8,760 = 328,500,000 scf/yr = 328.5 MMscf/yr
Annual Fuel Cost Calculation
Total Fuel Cost:
Fuel Cost = Q_fuel × Gas Price
Example (continued):
Gas price = $4.00/Mcf
Annual fuel cost = 328,500 Mcf × $4.00/Mcf = $1,314,000/year
Alternative: Cost per hp-hr
Fuel cost/hp-hr = BSFC × Gas Price
= 7.5 scf/hp-hr × $4.00/Mcf × (1 Mcf/1000 scf)
= $0.030/hp-hr
Annual cost = 5,000 hp × 8,760 hr × $0.030/hp-hr = $1,314,000 ✓
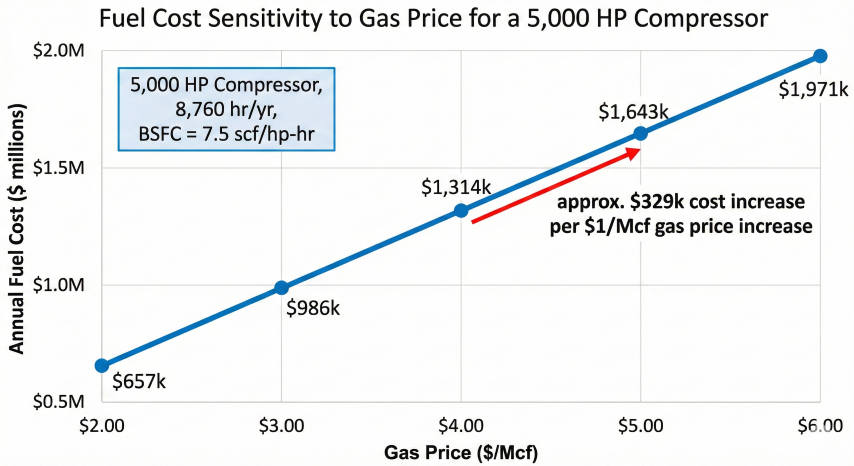
Fuel Cost Sensitivity to Gas Price
Fuel cost sensitivity to gas price for a 5,000 HP compressor showing approximately $329k annual cost increase per $1/Mcf gas price increase
Gas Price ($/Mcf)
Annual Fuel Cost (5,000 hp example)
Cost per hp-hr
$2.00
$657,000
$0.015
$3.00
$986,000
$0.0225
$4.00
$1,314,000
$0.030
$5.00
$1,643,000
$0.0375
$6.00
$1,971,000
$0.045
Gas Turbine Fuel Consumption
Gas Turbine Specific Fuel Consumption:
For gas turbines, fuel consumption depends on load:
BSFC_full = 9.0-11.0 scf/hp-hr (at 100% load)
BSFC_partial increases at lower loads (less efficient)
Heat rate method:
Heat Rate = 9,500-11,500 Btu/hp-hr (typical range)
Fuel consumption:
Q_fuel = HP × Hours × Heat Rate / HHV_gas
Where:
HHV_gas = Higher heating value (typically 1,030-1,050 Btu/scf for natural gas)
Example: 10,000 hp turbine, 8,000 hr/yr, HR = 10,500 Btu/hp-hr
Q_fuel = 10,000 × 8,000 × 10,500 / 1,035
= 840,000,000,000 / 1,035
= 811,594,203 scf/yr = 811.6 MMscf/yr
At $3.50/Mcf: Annual cost = $2,840,580
Electric Drive Compressor Power Cost
Electric Motor Power Consumption:
kW = (HP × 0.746) / η_motor
Where:
kW = Electrical power (kilowatts)
HP = Motor horsepower
0.746 = Conversion factor (kW per hp)
η_motor = Motor efficiency (0.93-0.97 typical)
Annual electricity:
kWh = kW × Hours × Load Factor
Electricity cost:
Cost = kWh × Electric Rate ($/kWh)
Example: 5,000 hp motor, 95% efficiency, $0.08/kWh, 8,760 hr/yr
kW = (5,000 × 0.746) / 0.95 = 3,926 kW
kWh = 3,926 × 8,760 = 34,394,000 kWh/yr
Cost = 34,394,000 × $0.08 = $2,751,520/year
Compare to gas engine: $1,314,000 at $4/Mcf (gas cheaper in this example)
Fuel Optimization Strategies
Load optimization: Operate compressors at best efficiency point (BEP), typically 75-85% capacity
Unit selection: Run most efficient units first, shutdown least efficient during low demand
Maintenance: Regular tune-ups maintain fuel efficiency; degraded units can use 10-15% more fuel
Technology upgrades: Replace old units with high-efficiency engines or electric drives
VFD drives: Variable frequency drives for electric motors reduce energy at partial load
Heat recovery: Combined heat and power (CHP) if thermal load available
Fuel hedging: Financial instruments to lock in gas prices, reduce cost volatility
Fuel cost impact: At $4/Mcf gas price, a 1,000 hp compressor running 8,760 hr/yr costs ~$263,000/year in fuel. A 10% efficiency improvement saves $26,300/year. Over 20-year life, PV of savings at 9% discount = $240,000 - often justifies upgrade investment.
Fuel Retainage (In-Kind Fuel)
Many pipelines retain portion of shipper gas as fuel payment:
Fuel Retainage Percentage:
Fuel % = (Fuel consumed / Throughput) × 100%
Example: 500 MMcf/day throughput, 25 MMcf/day fuel
Fuel % = (25 / 500) × 100% = 5.0%
Shipper receives: 500 - 25 = 475 MMcf/day delivered
Alternatively, shipper provides fuel gas separately
(common for gathering systems)
Fuel retainage appears in tariff:
"Carrier retains 5.0% of receipts as fuel and line loss"
Fuel vs. Electric Drive Economics
Factor
Gas Engine Drive
Electric Motor Drive
Capital cost
Lower ($500-800/hp installed)
Higher ($800-1,200/hp with switchgear)
Operating cost
Variable with gas price ($0.02-0.05/hp-hr)
Variable with electric rate ($0.03-0.10/hp-hr)
Maintenance
Higher (oil changes, overhauls every 8,000-16,000 hr)
Lower (bearings, minimal wear parts)
Availability
92-96% (scheduled/unscheduled downtime)
98-99% (very reliable)
Emissions
NOx, CO emissions (require permits)
Zero on-site emissions
Noise
High (85-95 dBA, soundproofing needed)
Low (65-75 dBA)
Best application
Remote locations, low electric rates unavailable
Urban areas, low electric rates, emissions concerns
3. Maintenance & Labor
Maintenance and labor costs are significant OPEX components, typically 30-45% of total operating expenses after fuel. These costs increase with asset age and complexity.
Staffing and Labor Cost:
Typical staffing for medium transmission system:
- Control room operators: 4 FTE (24/7 coverage) × $85,000 = $340,000
- Field operators: 3 FTE × $75,000 = $225,000
- Maintenance technicians: 4 FTE × $80,000 = $320,000
- Supervisor: 1 FTE × $110,000 = $110,000
- Manager: 1 FTE × $140,000 = $140,000
Subtotal salaries: $1,135,000
Benefits and burden (40% of salaries): $454,000
Total annual labor cost: $1,589,000
For 500-mile, 500 MMcf/day system:
Labor per mile: $1,589,000 / 500 = $3,178/mile
Labor per Mcf throughput: $1,589,000 / (500,000 × 365) = $0.0087/Mcf
Automation Impact on Labor
Automation Level
Staffing
Annual Labor Cost
CAPEX Premium
Manual (minimal SCADA)
15-20 FTE
$1.5-2.0M/year
Baseline
Semi-automated (basic SCADA)
10-15 FTE
$1.0-1.5M/year
+5-10% CAPEX
Fully automated (advanced SCADA)
6-10 FTE
$0.6-1.0M/year
+10-20% CAPEX
Unmanned (remote operations)
4-6 FTE
$0.4-0.6M/year
+15-25% CAPEX
Integrity Management Costs
Pipeline integrity programs per ASME B31.8S and 49 CFR Part 192 Subpart O:
Annual Integrity Costs (Transmission Pipeline):
In-line inspection (ILI):
- MFL tool run: $20,000-$40,000 per 100 miles (every 5-7 years)
- Annualized: $5,000-$8,000 per 100 miles/year
- UT tool run: $30,000-$50,000 per 100 miles (every 7-10 years)
- Annualized: $4,000-$7,000 per 100 miles/year
Excavations and repairs:
- Assume 5 digs per 100 miles/year
- Cost per dig: $15,000-$30,000 (excavation, coating repair, backfill)
- Annual: $75,000-$150,000 per 100 miles
Cathodic protection:
- Annual surveys: $500-$1,000/mile
- Rectifier power: $200-$500/mile
- Anode replacement: $300-$800/mile (amortized)
- Total CP: $1,000-$2,300/mile/year
For 500-mile system:
ILI: (5+4) × 5 segments = $45,000/year
Excavations: 25 digs × $22,500 = $562,500/year
CP: 500 miles × $1,650 = $825,000/year
Total integrity: $1,432,500/year ($2,865/mile)
Property Taxes and Insurance
Fixed Annual Costs:
Property taxes (ad valorem):
Tax = Assessed Value × Tax Rate
Typical: 1-3% of replacement value per year
Example: $100M system, 2% tax rate
Annual tax = $100M × 0.02 = $2M/year
Insurance premiums:
- Property insurance: 0.1-0.3% of insured value
- Liability insurance: $500,000-$2,000,000 annual premium
- Environmental coverage: $200,000-$800,000 annual premium
Example: $100M system
Property: $100M × 0.2% = $200,000
Liability: $1,000,000
Environmental: $500,000
Total insurance: $1,700,000/year
Maintenance strategy: Preventive maintenance costs 1/3 to 1/5 of corrective maintenance. Well-planned PM programs reduce unplanned failures, improve availability, and lower total lifecycle costs. Industry benchmark: PM costs should be 3-5× corrective costs (70-80% PM, 20-30% CM).
Total OPEX Example - 500-Mile Transmission System
Cost Category
Annual Cost
Percent of Total
$/Mile
Compressor fuel (5 stations)
$6,570,000
52%
$13,140
Operations labor
$1,589,000
13%
$3,178
Maintenance (labor + materials)
$1,800,000
14%
$3,600
Integrity management
$1,433,000
11%
$2,866
Property taxes
$800,000
6%
$1,600
Insurance
$400,000
3%
$800
Administrative overhead
$200,000
2%
$400
Total OPEX
$12,792,000
100%
$25,584/mile
Throughput: 500 MMcf/day × 365 days = 182,500 MMcf/year
Unit cost: $12,792,000 / 182,500 MMcf = $0.070/Mcf
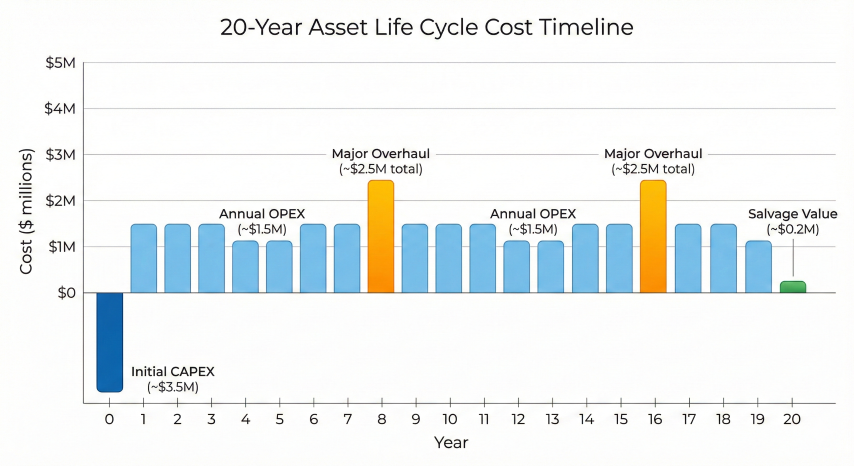
4. Life Cycle Costing
Life cycle cost (LCC) analysis evaluates total cost of ownership over asset lifetime, including CAPEX, OPEX, and disposal costs. Used for equipment selection, design optimization, and replacement decisions.
20-year asset life cycle cost timeline showing initial capital, annual operating costs, major overhauls, and end-of-life salvage value
Life Cycle Cost Formula
Total Life Cycle Cost:
LCC = IC + PV(OPEX) + PV(Disposal) - PV(Salvage)
Where:
IC = Initial capital cost (CAPEX)
PV(OPEX) = Present value of operating costs over life
PV(Disposal) = Present value of decommissioning/disposal costs
PV(Salvage) = Present value of salvage/resale value
For recurring annual OPEX:
PV(OPEX) = Annual_OPEX × [(1 - (1+r)^-N) / r]
Where:
r = Discount rate (WACC)
N = Asset life (years)
LCC Example - Compressor Selection
Compare Gas Engine vs. Electric Motor Drive
Option A: Gas engine compressor
- Initial cost: $3,000,000
- Annual fuel: $1,314,000 (at $4/Mcf)
- Annual maintenance: $226,000
- Total annual OPEX: $1,540,000
- Salvage value (Year 20): $200,000
- Life: 20 years, WACC = 9%
LCC_A = 3,000,000 + 1,540,000 × [(1-1.09^-20)/0.09] - 200,000/(1.09)^20
= 3,000,000 + 1,540,000 × 9.129 - 200,000 × 0.1784
= 3,000,000 + 14,059,000 - 35,680
= $17,023,320
Option B: Electric motor drive
- Initial cost: $4,500,000 (higher CAPEX)
- Annual electricity: $2,752,000 (at $0.08/kWh)
- Annual maintenance: $120,000 (lower than engine)
- Total annual OPEX: $2,872,000
- Salvage value (Year 20): $300,000
- Life: 20 years, WACC = 9%
LCC_B = 4,500,000 + 2,872,000 × 9.129 - 300,000 × 0.1784
= 4,500,000 + 26,218,000 - 53,520
= $30,664,480
Decision: Gas engine has lower LCC ($17.0M vs. $30.7M)
Savings: $13.6M over 20-year life
Sensitivity: At $0.05/kWh electric rate, Option B becomes competitive
Higher upfront cost for reliable equipment often justified
Asset life
Longer life spreads CAPEX, but more maintenance
Discount rate reduces value of distant cash flows
Salvage value
Small impact (heavily discounted)
Typically 5-15% of LCC, low PV at end of life
Replacement Analysis
Determine optimal time to replace aging equipment:
Example: Replace vs. Continue Operating Old Compressor
Current unit (20 years old, 5,000 hp):
- Fuel (10% degraded efficiency): $1,314,000 × 1.10 = $1,445,400/year
- Maintenance (increasing with age): $400,000/year
- Expected failure cost: 15% probability × $2M = $300,000/year
Total annual cost to continue: $1,445,400 + $400,000 + $300,000 = $2,145,400/year
New replacement unit:
- Capital cost: $3,500,000
- Annual fuel (efficient): $1,314,000/year
- Annual maintenance: $226,000/year
- Total annual OPEX: $1,540,000/year
Annual savings from replacement:
$2,145,400 - $1,540,000 = $605,400/year ≈ $605,000/year
NPV of replacement (9% discount, 20-year life):
NPV = -3,500,000 + 605,000 × [(1-1.09^-20)/0.09]
= -3,500,000 + 605,000 × 9.129
= -3,500,000 + 5,523,000
= $2,023,000 positive NPV → Replace now ✓
LCC vs. lowest CAPEX: Lowest initial cost often not lowest lifecycle cost. Example: $500k cheaper compressor with 5% higher fuel consumption costs $1.0M+ more over 20 years in fuel. Always evaluate total cost of ownership, not just purchase price.
Design Optimization Using LCC
Example: Pipeline Diameter Selection
Two options for 100-mile pipeline, 400 MMcf/day:
Option 1: NPS 24 (smaller diameter)
- CAPEX: $180M ($1.8M/mile)
- Compression: 12,000 hp required
- Annual fuel: $7.9M (high due to higher ΔP)
- Annual maintenance: $2.0M
- OPEX: $9.9M/year
LCC_24 = 180M + 9.9M × 9.129 = 180M + 90.4M = $270.4M
Option 2: NPS 30 (larger diameter)
- CAPEX: $240M ($2.4M/mile, 33% more expensive)
- Compression: 6,000 hp required (50% reduction)
- Annual fuel: $3.95M (half of Option 1)
- Annual maintenance: $1.5M
- OPEX: $5.45M/year
LCC_30 = 240M + 5.45M × 9.129 = 240M + 49.8M = $289.8M
Result: NPS 24 has lower LCC despite higher operating costs
Reason: CAPEX difference ($60M) exceeds PV of OPEX savings ($40M)
Sensitivity: If project life extended to 30 years:
PV factor at 9%, 30 yr = 10.274
LCC_24 = 180M + 9.9M × 10.274 = $281.7M
LCC_30 = 240M + 5.45M × 10.274 = $296.0M
Still favors NPS 24, but margin narrows
LCC Best Practices
Use consistent assumptions: Same discount rate, project life, cost escalation for all options
Include all relevant costs: Energy, maintenance, disposal, downtime/lost revenue
Sensitivity analysis: Test impact of energy price, project life, discount rate variations
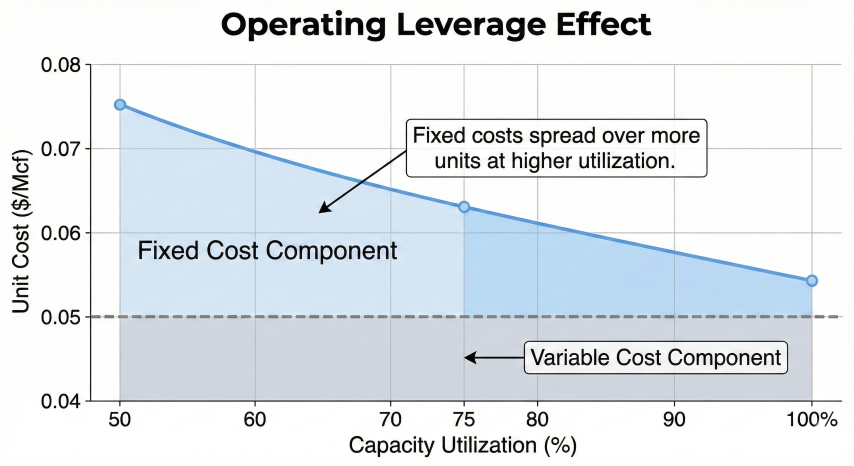
Impact of throughput changes on unit costs and profitability:
Operating leverage effect showing how unit costs decrease as fixed costs are spread over more throughput units
Example: Volume Sensitivity
Fixed costs (independent of volume):
- Labor: $1,589,000
- Property tax: $800,000
- Insurance: $400,000
- Admin: $200,000
Total fixed: $2,989,000/year
Variable costs (proportional to volume):
- Fuel: $6,570,000 (for 500 MMcf/day base)
- Maintenance materials: $900,000
Total variable: $7,470,000/year
At base volume (500 MMcf/day = 182,500 MMcf/year):
Unit cost = ($2,989,000 + $7,470,000) / 182,500 = $0.057/Mcf
At 75% utilization (375 MMcf/day = 136,875 MMcf/year):
Variable costs scale: $7,470,000 × 0.75 = $5,602,500
Total cost: $2,989,000 + $5,602,500 = $8,591,500
Unit cost: $8,591,500 / 136,875 = $0.063/Mcf (10% higher)
At 100% capacity (650 MMcf/day = 237,250 MMcf/year):
Variable costs: $7,470,000 × 1.30 = $9,711,000
Total cost: $2,989,000 + $9,711,000 = $12,700,000
Unit cost: $12,700,000 / 237,250 = $0.054/Mcf (6% lower)
Conclusion: High fixed costs → unit costs drop significantly with volume
Operating leverage favors high-utilization operation
OPEX Reduction Initiatives
Initiative
Typical Savings
Implementation Cost
Payback Period
Compressor efficiency upgrades
5-15% fuel reduction
$500k-$2M per unit
2-4 years
SCADA/automation expansion
20-40% labor reduction
$2M-$10M system-wide
3-6 years
Predictive maintenance program
15-25% maintenance cost reduction
$200k-$500k setup
1-2 years
LED lighting retrofit
50-70% lighting energy
$50k-$200k
<1 year
Waste heat recovery (CHP)
10-20% total energy
$1M-$5M
4-8 years
Cathodic protection optimization
10-30% CP power
$100k-$300k
1-3 years
OPEX Benchmarking
Industry benchmarking for continuous improvement:
Peer comparison: Compare OPEX/mile, OPEX/Mcf to similar systems (size, age, terrain)
KPIs to track: Availability %, maintenance cost per asset, fuel efficiency (scf/hp-hr), labor productivity (miles/FTE)
Data sources: FERC Form 2 (interstate pipelines), industry surveys, operator groups
Typical ranges: Top quartile operators achieve 15-30% lower OPEX than industry average
OPEX optimization priority: Focus on largest cost drivers first. For gas transmission, fuel is 40-60% of OPEX, so 10% fuel savings = 4-6% total OPEX reduction. Maintenance and labor optimization important but smaller impact. Use Pareto principle: 80% of savings from 20% of initiatives.
Industry Standards and References
FERC regulations: Cost-of-service tariff methodology, Form 2 annual reporting requirements
ASME B31.8S: Pipeline integrity management costs and best practices
API 1173: Pipeline safety management systems (SMS)
ISO 55000: Asset management - principles and terminology
NACE SP0169: Cathodic protection costs and effectiveness
Society for Maintenance & Reliability Professionals (SMRP): Maintenance best practices
IRS Publication 535: Business expenses deductibility (OPEX tax treatment)
What are the major categories of pipeline operating costs (OPEX)?+
Major OPEX categories include fuel and power costs for compression (typically 40-60% of total OPEX), maintenance and repair costs, labor and personnel, chemical and consumables, insurance and regulatory compliance, and right-of-way fees. Total OPEX typically runs 2-5% of installed capital cost per year.
How are fuel costs estimated for pipeline compressor stations?+
Fuel costs depend on compressor horsepower, fuel consumption rate, and gas price. Gas-engine-driven compressors consume approximately 7,000-9,000 BTU/HP-hr. Annual fuel cost = HP × fuel rate × hours × gas price / heating value. Fuel is typically the single largest operating expense.
What is the typical maintenance cost as a percentage of capital for midstream facilities?+
Maintenance costs typically range from 1-3% of installed capital cost per year for pipeline facilities. Compressor stations tend toward the higher end due to rotating equipment maintenance, while pipeline segments are lower. Major overhauls every 3-5 years should be included in lifecycle cost projections.
How does life cycle costing differ from annual OPEX budgeting?+
Life cycle costing considers all costs over the entire project life including initial capital, annual OPEX, major overhauls, equipment replacement, and decommissioning, all discounted to present value. This approach reveals the true long-term cost of ownership and enables better comparison between alternatives.