Maximize NGL recovery while minimizing energy consumption through proper process selection, heat integration, and equipment optimization per GPSA Section 16.
NGL recovery extracts ethane, propane, butanes, and heavier hydrocarbons from natural gas. The process selection depends on feed composition, product specifications, and economics. Recovery efficiency is primarily controlled by temperature - lower temperatures yield higher recovery but require more energy.
Turboexpander (GSP)
90-95% C2 Recovery
Cryogenic process at -100°F. Gas Subcooled Process (GSP) is industry standard for high ethane recovery.
JT (Joule-Thomson)
40-70% C2 Recovery
Simple isenthalpic expansion. Lower capital, suitable for lean gas or ethane rejection.
Refrigerated Lean Oil
70-85% C2 Recovery
Absorption process using chilled lean oil. Good for moderate NGL content.
Nitrogen Rejection (NRU)
90-97% N₂ Rejection
Double-column cryogenic at -260°F. Required when feed N₂ exceeds pipeline spec.
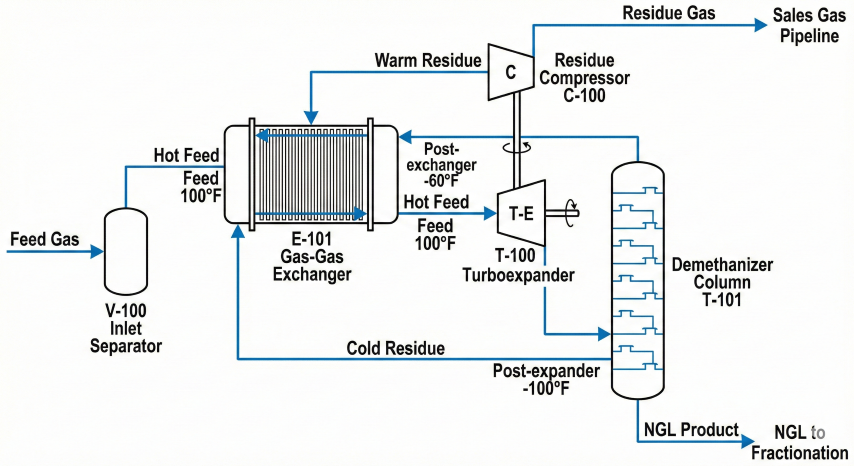
Turboexpander plant PFD showing key equipment and temperature profile for cryogenic NGL recovery per GPSA Section 16.
Ethane Recovery vs. Temperature
Recovery efficiency follows thermodynamic equilibrium. The relationship between process temperature and recovery is nonlinear - significant improvements require increasingly lower temperatures.
Ethane Recovery Correlation (GPSA Section 16):
At 450 psig operating pressure:
Temperature (°F) C2 Recovery (%)
-100 98.0
-80 95.0
-60 86.0
-40 68.0
-20 43.0
0 20.0
Key relationships:
• Each 20°F temperature reduction → 10-15% recovery increase
• Higher pressure = lower recovery at same temperature
• C3+ recovery is always higher than C2 at same conditions
Economics example:
Feed: 100 MMscfd, 10% C2 (10 MMscfd ethane)
At -40°F: 68% recovery → 6.8 MMscfd C2 recovered
At -100°F: 98% recovery → 9.8 MMscfd C2 recovered
Additional recovery: 3.0 MMscfd
At $0.25/gal ethane (2.37 gal/Mscf):
Additional revenue = 3,000 Mscfd × 2.37 gal/Mscf × $0.25/gal = $1,778/day = $649K/year
Energy cost for -60°F additional cooling:
~0.5 MMBtu/MMscf × 100 MMscfd × $3/MMBtu = $150/day = $55K/year
Net benefit: ~$594K/year (justifies turboexpander investment)
Process Selection Guide
Process
C2 Recovery
C3+ Recovery
Typical Temperature
Best Application
GSP (Gas Subcooled Process)
90-95%
99+%
-100 to -120°F
Rich gas, high ethane value
SCORE (Single Column ORE)
92-97%
99+%
-100 to -130°F
Maximum C2 recovery
CRR (Cold Residue Recycle)
85-92%
99+%
-90 to -110°F
High CO₂ feeds
JT + External Refrigeration
50-75%
95-98%
-40 to -60°F
Moderate NGL, low capital
Straight JT
20-50%
80-95%
-20 to -40°F
Lean gas, C2 rejection
Refrigerated Lean Oil
70-85%
95-99%
-30 to -50°F
Older plants, retrofits
Ethane rejection mode: When ethane prices are low relative to natural gas, plants operate in "ethane rejection" mode by increasing temperature to ~0°F. This reduces C2 recovery to 20-30%, leaving ethane in the sales gas (increasing its heating value) while still recovering 90%+ C3+. The ability to swing between ethane recovery and rejection provides operational flexibility to optimize economics based on market conditions.
2. Efficiency Metrics
Process efficiency measures how effectively inputs are converted to outputs. For NGL plants, key metrics include component recovery, energy consumption per unit product, and comparison to thermodynamic limits.
Key Efficiency Definitions
Recovery Efficiency:
η_recovery = (Component recovered in NGL) / (Component in feed) × 100%
Example - Ethane Recovery:
Feed: 100 MMscfd at 10 mol% C2 = 10 MMscfd C2
NGL product: Contains 9.2 MMscfd C2
η_C2 = 9.2 / 10.0 × 100% = 92%
Specific Energy Consumption:
SEC = Total energy input / Product output
Units: MMBtu/MMscf NGL, kWh/gal NGL, BTU/lb NGL
Typical values (turboexpander plants):
• Rich gas (6+ GPM): 0.6-0.8 MMBtu/MMscf NGL
• Lean gas (2-4 GPM): 1.0-1.5 MMBtu/MMscf NGL
GPM (Gallons per Mscf):
Standard measure of NGL content in feed gas.
GPM = Σ (Component mol% × GPM factor)
GPM factors at 60°F, 14.7 psia:
C2 = 2.37 gal/Mscf per mol%
C3 = 3.14 gal/Mscf per mol%
iC4 = 3.56 gal/Mscf per mol%
nC4 = 3.59 gal/Mscf per mol%
C5+ = 4.0-5.0 gal/Mscf per mol%
Example:
Feed composition: 8% C2, 4% C3, 2% C4+
GPM = 8×0.0237 + 4×0.0314 + 2×0.036 = 0.19 + 0.13 + 0.07 = 0.39 × 100 = 3.9 GPM
Shrinkage:
Reduction in sales gas volume due to NGL extraction.
Shrinkage% = (Feed volume - Residue volume) / Feed volume × 100%
Typical: 5-15% for rich gas plants
Energy Balance for NGL Plant
Understanding where energy is consumed enables optimization:
Energy Consumer
% of Total
Typical Load
Optimization Opportunity
Residue gas compression
35-50%
5,000-20,000 HP
Maximize expander work recovery
Refrigeration compressor
20-35%
2,000-10,000 HP
Heat integration, optimal staging
Demethanizer reboiler
10-20%
5-20 MMBtu/hr
Optimize reflux ratio, feed preheat
Inlet compression (if any)
0-15%
0-5,000 HP
Optimize inlet pressure
Utilities (pumps, air coolers)
5-10%
500-2,000 HP
VFDs, efficient motors
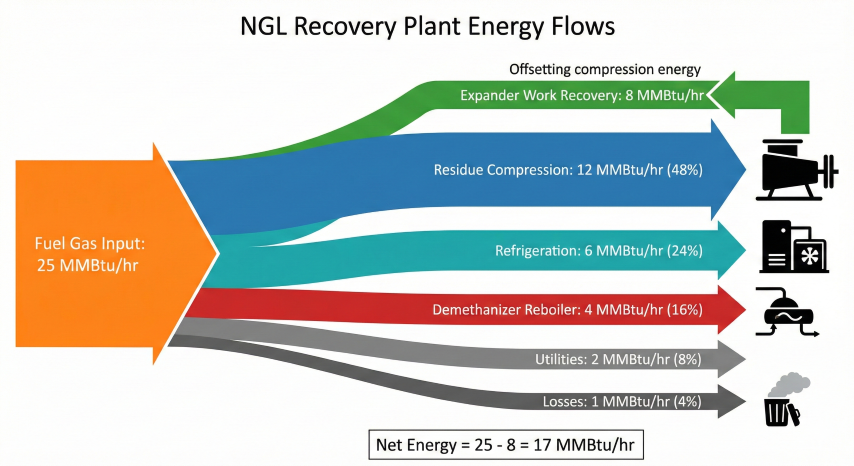
Energy flow distribution in NGL plant showing compression as dominant consumer (48%) and expander work recovery reducing net energy to 17 MMBtu/hr.
Turboexpander energy recovery: The turboexpander is key to efficient cryogenic plants. It performs isentropic expansion (unlike JT valve which is isenthalpic), producing work that drives the residue compressor. A well-designed expander recovers 60-80% of residue compression power, dramatically reducing net energy consumption. Expander efficiency of 85-88% is typical; below 80% indicates fouling or mechanical issues.
3. Heat Integration & Pinch Analysis
Heat integration maximizes heat recovery between process streams, minimizing external heating and cooling utilities. Pinch analysis provides a systematic methodology to identify the optimal heat exchanger network.
Pinch Analysis Fundamentals
Pinch Analysis Steps:
1. Extract stream data:
For each stream: T_supply, T_target, ṁ×Cp (heat capacity rate)
Classify as Hot (needs cooling) or Cold (needs heating)
2. Construct composite curves:
Hot composite: cumulative enthalpy vs temperature for all hot streams
Cold composite: same for cold streams
3. Set minimum approach (ΔT_min):
Typical: 10-20°F for cryogenic, 20-40°F for ambient exchangers
Trade-off: smaller ΔT_min = more recovery but larger exchangers
4. Identify pinch point:
Location where composites are closest (separated by ΔT_min)
Divides problem into two regions:
• Above pinch: heat sink (requires hot utility)
• Below pinch: heat source (requires cold utility)
5. Design network following "golden rules":
• Never transfer heat across pinch
• No cold utility above pinch
• No hot utility below pinch
NGL Plant Heat Integration Example:
Hot streams (need cooling):
H1: Inlet gas, 100°F → -100°F, CP = 50,000 BTU/hr·°F
H2: Residue gas from column, -140°F → 100°F, CP = 45,000 BTU/hr·°F
Cold streams (need heating):
C1: Demethanizer feed, -100°F → -50°F, CP = 30,000 BTU/hr·°F
C2: NGL product, -140°F → 60°F, CP = 10,000 BTU/hr·°F
Without integration:
External cooling = 50,000×200 + 45,000×240 = 20.8 MMBtu/hr
External heating = 30,000×50 + 10,000×200 = 3.5 MMBtu/hr
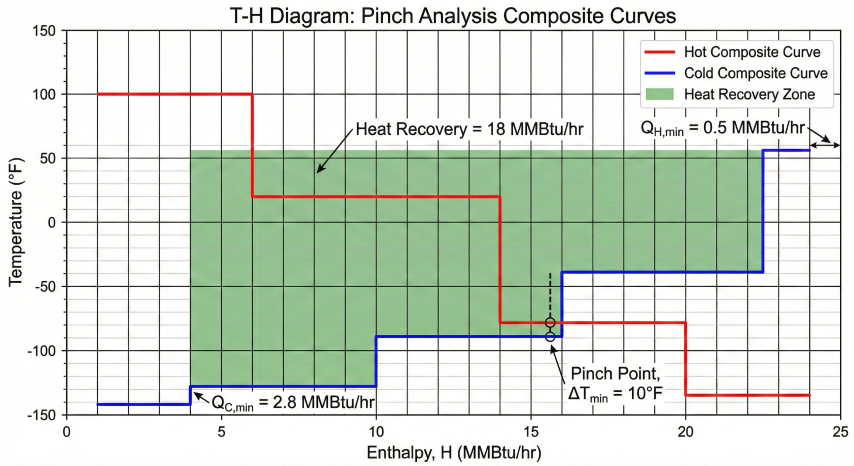
With pinch analysis (ΔT_min = 10°F):
Pinch at -90°F
Maximum heat recovery = 18 MMBtu/hr
Minimum external cooling = 2.8 MMBtu/hr (87% reduction)
Minimum external heating = 0.5 MMBtu/hr (86% reduction)
Composite curves for pinch analysis identifying minimum utility requirements (QH,min, QC,min) and maximum heat recovery potential.
Gas-Gas Exchanger Design
The gas-gas exchanger is the heart of cryogenic NGL plants, recovering cold from residue gas to precool inlet gas:
Parameter
Typical Value
Impact of Poor Design
Cold-end approach (LMTD)
5-15°F
Larger approach = more refrigeration required
Effectiveness (ε)
90-95%
Lower ε = higher energy consumption
Pressure drop (per side)
2-5 psi
Higher ΔP = more compression power
UA (overall conductance)
10-50 MMBtu/hr·°F
Fouling reduces UA, increases utilities
Brazed aluminum heat exchangers (BAHX): Cryogenic NGL plants use BAHX for gas-gas exchangers due to their high surface area per volume (up to 1,500 ft²/ft³), close temperature approach capability (5°F), and ability to handle multiple streams in a single core. BAHX require clean, dry gas - CO₂ and water must be removed upstream to prevent freezing and exchanger damage. Typical BAHX service life exceeds 30 years with proper operation.
4. Equipment Efficiency
Individual equipment efficiency directly impacts overall plant performance. Degradation from fouling, wear, or off-design operation can increase energy consumption 10-30%.
Turboexpander Efficiency
Turboexpander Performance:
Isentropic efficiency:
η_exp = (h_in - h_out,actual) / (h_in - h_out,isentropic)
Typical: 85-88% (new), 80-85% (after 5 years)
Temperature drop:
ΔT_actual = η_exp × ΔT_isentropic
Power recovered:
HP = ṁ × (h_in - h_out) / 2545
Example:
Feed: 100 MMscfd, MW = 20, inlet 500 psia / 60°F
Outlet: 250 psia
η_exp = 85%
Isentropic ΔT = 60°F × [1 - (250/500)^0.23] = 60 × 0.15 = 9°F...
[More complex calculation for real gas - actual ΔT ≈ 80-100°F]
Power = ~3,000 HP recovered (drives residue compressor booster)
Efficiency Degradation Causes:
• Liquid carryover: Erodes blades, -2-5% efficiency
• Fouling: Hydrocarbon deposits on wheel, -1-3%
• Seal leakage: Bypass around wheel, -1-5%
• Off-design speed: Operating far from best efficiency point
Monitoring:
Track ΔT across expander vs design curve
Efficiency drop > 5% → schedule inspection
Compressor Efficiency
Residue Compressor Performance:
Isentropic efficiency:
η_comp = (T_out,isen - T_in) / (T_out,actual - T_in)
Typical centrifugal: 75-82%
Typical reciprocating: 80-88%
Power requirement:
HP = (ṁ × Cp × T_in / η_comp) × [(P_out/P_in)^((k-1)/k) - 1] × (k/(k-1))
Simplified:
HP ≈ Q_acfm × ΔP_psi / (229 × η_comp)
Energy cost of inefficiency:
5000 HP compressor, η drops from 80% to 75%:
Power increase = 5000 × (0.80/0.75 - 1) = 333 HP
Fuel penalty = 333 HP × 8000 hr/yr × 9500 BTU/HP·hr / 0.30 turbine eff
= 84 MMscf/yr fuel increase
Cost @ $3/MMBtu = $252K/year
Cleaning cost: $50K → Payback: 2.4 months
Demethanizer Column Efficiency
The demethanizer separates methane from NGL. Efficient operation requires proper reflux ratio and tray hydraulics:
Parameter
Target
Symptom of Problem
C1 in NGL bottoms
< 1.5 mol%
High = insufficient reflux or trays
C2 in overhead
< 2% of feed C2
High = too much reflux (energy waste) or temperature too high
Tray efficiency
65-75%
Low = fouling, damage, maldistribution
Reflux ratio
1.2-1.5 × minimum
High = excess reboiler duty
Column ΔP
Per design ± 10%
High = flooding or fouling
Advanced process control (APC): Implementing APC on the demethanizer typically saves 5-10% reboiler duty while maintaining or improving product specs. APC optimizes reflux ratio in real-time based on feed composition changes, minimizing energy while respecting constraints. Typical APC project cost: $200-500K. Payback: 6-18 months for 100+ MMscfd plants.
5. Performance KPIs
Systematic KPI monitoring identifies efficiency degradation early, enabling corrective action before significant losses occur. Track both energy and production metrics.
Key Performance Indicators
KPI
Calculation
Target
Action Threshold
C2 recovery efficiency
C2 in NGL / C2 in feed × 100%
Design ± 2%
< Design - 5% → investigate
C3+ recovery
C3+ in NGL / C3+ in feed × 100%
> 98%
< 95% → check temperature, trays
Specific energy
Total energy / NGL produced
Benchmark ± 10%
> Benchmark + 15% → energy audit
Expander efficiency
From T, P measurements
> 82%
< 80% → inspect, clean
Compressor efficiency
Isentropic / actual work
> 76%
< 74% → cleaning, inspection
Heat exchanger UA
Q / LMTD
Design ± 15%
< Design - 20% → clean
Plant availability
Operating hrs / total hrs
> 95%
< 92% → reliability review
Benchmarking Data
Industry Benchmarks (GPSA, Solomon):
NGL Recovery Plants (turboexpander):
Best Average Poor
C2 Recovery (%) 95+ 90-94 <88
C3+ Recovery (%) 99+ 97-98 <96
Specific Energy 0.6 0.8-1.0 >1.2
(MMBtu/MMscf NGL)
Plant Availability (%) 98+ 94-96 <92
Energy Distribution:
• Compression: 50-60% of total
• Refrigeration: 20-30%
• Heating (reboilers): 10-20%
• Utilities: 5-10%
Optimization Priorities:
1. Maximize expander work recovery (biggest impact)
2. Optimize cold-side heat integration
3. Minimize demethanizer reflux ratio
4. Reduce pressure drops throughout
5. Maintain equipment efficiency (cleaning, maintenance)
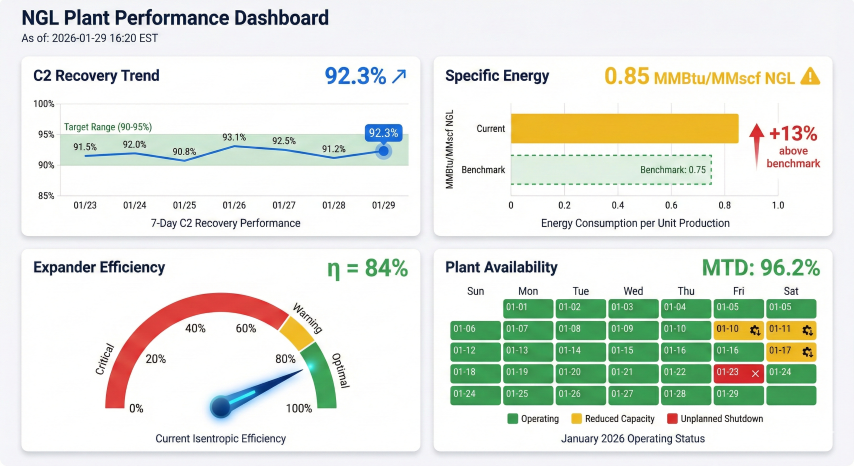
Real-time KPI dashboard for NGL plant monitoring enabling rapid detection of efficiency degradation.
Continuous improvement cycle: Best-in-class operators follow a systematic improvement process: (1) Establish baseline performance during commissioning or after major turnaround, (2) Monitor KPIs weekly with automated alerts, (3) Investigate deviations within 48 hours, (4) Implement corrective actions and track results, (5) Re-baseline annually and set stretch targets (2-3% improvement/year). Typical result: 15-25% energy reduction over 5 years compared to status quo operation.