1. The Joule-Thomson Effect
Gas expanding through a valve without external work (isenthalpic process) changes temperature. Natural gas at typical conditions cools on expansion.
Sign Convention
| Condition | μ_JT | Effect |
|---|---|---|
| Normal operation (T < 300°F) | > 0 | Gas cools on expansion |
| Above inversion temp (~800°F+) | < 0 | Gas heats on expansion |
| Ideal gas | = 0 | No temperature change |
2. J-T Coefficients
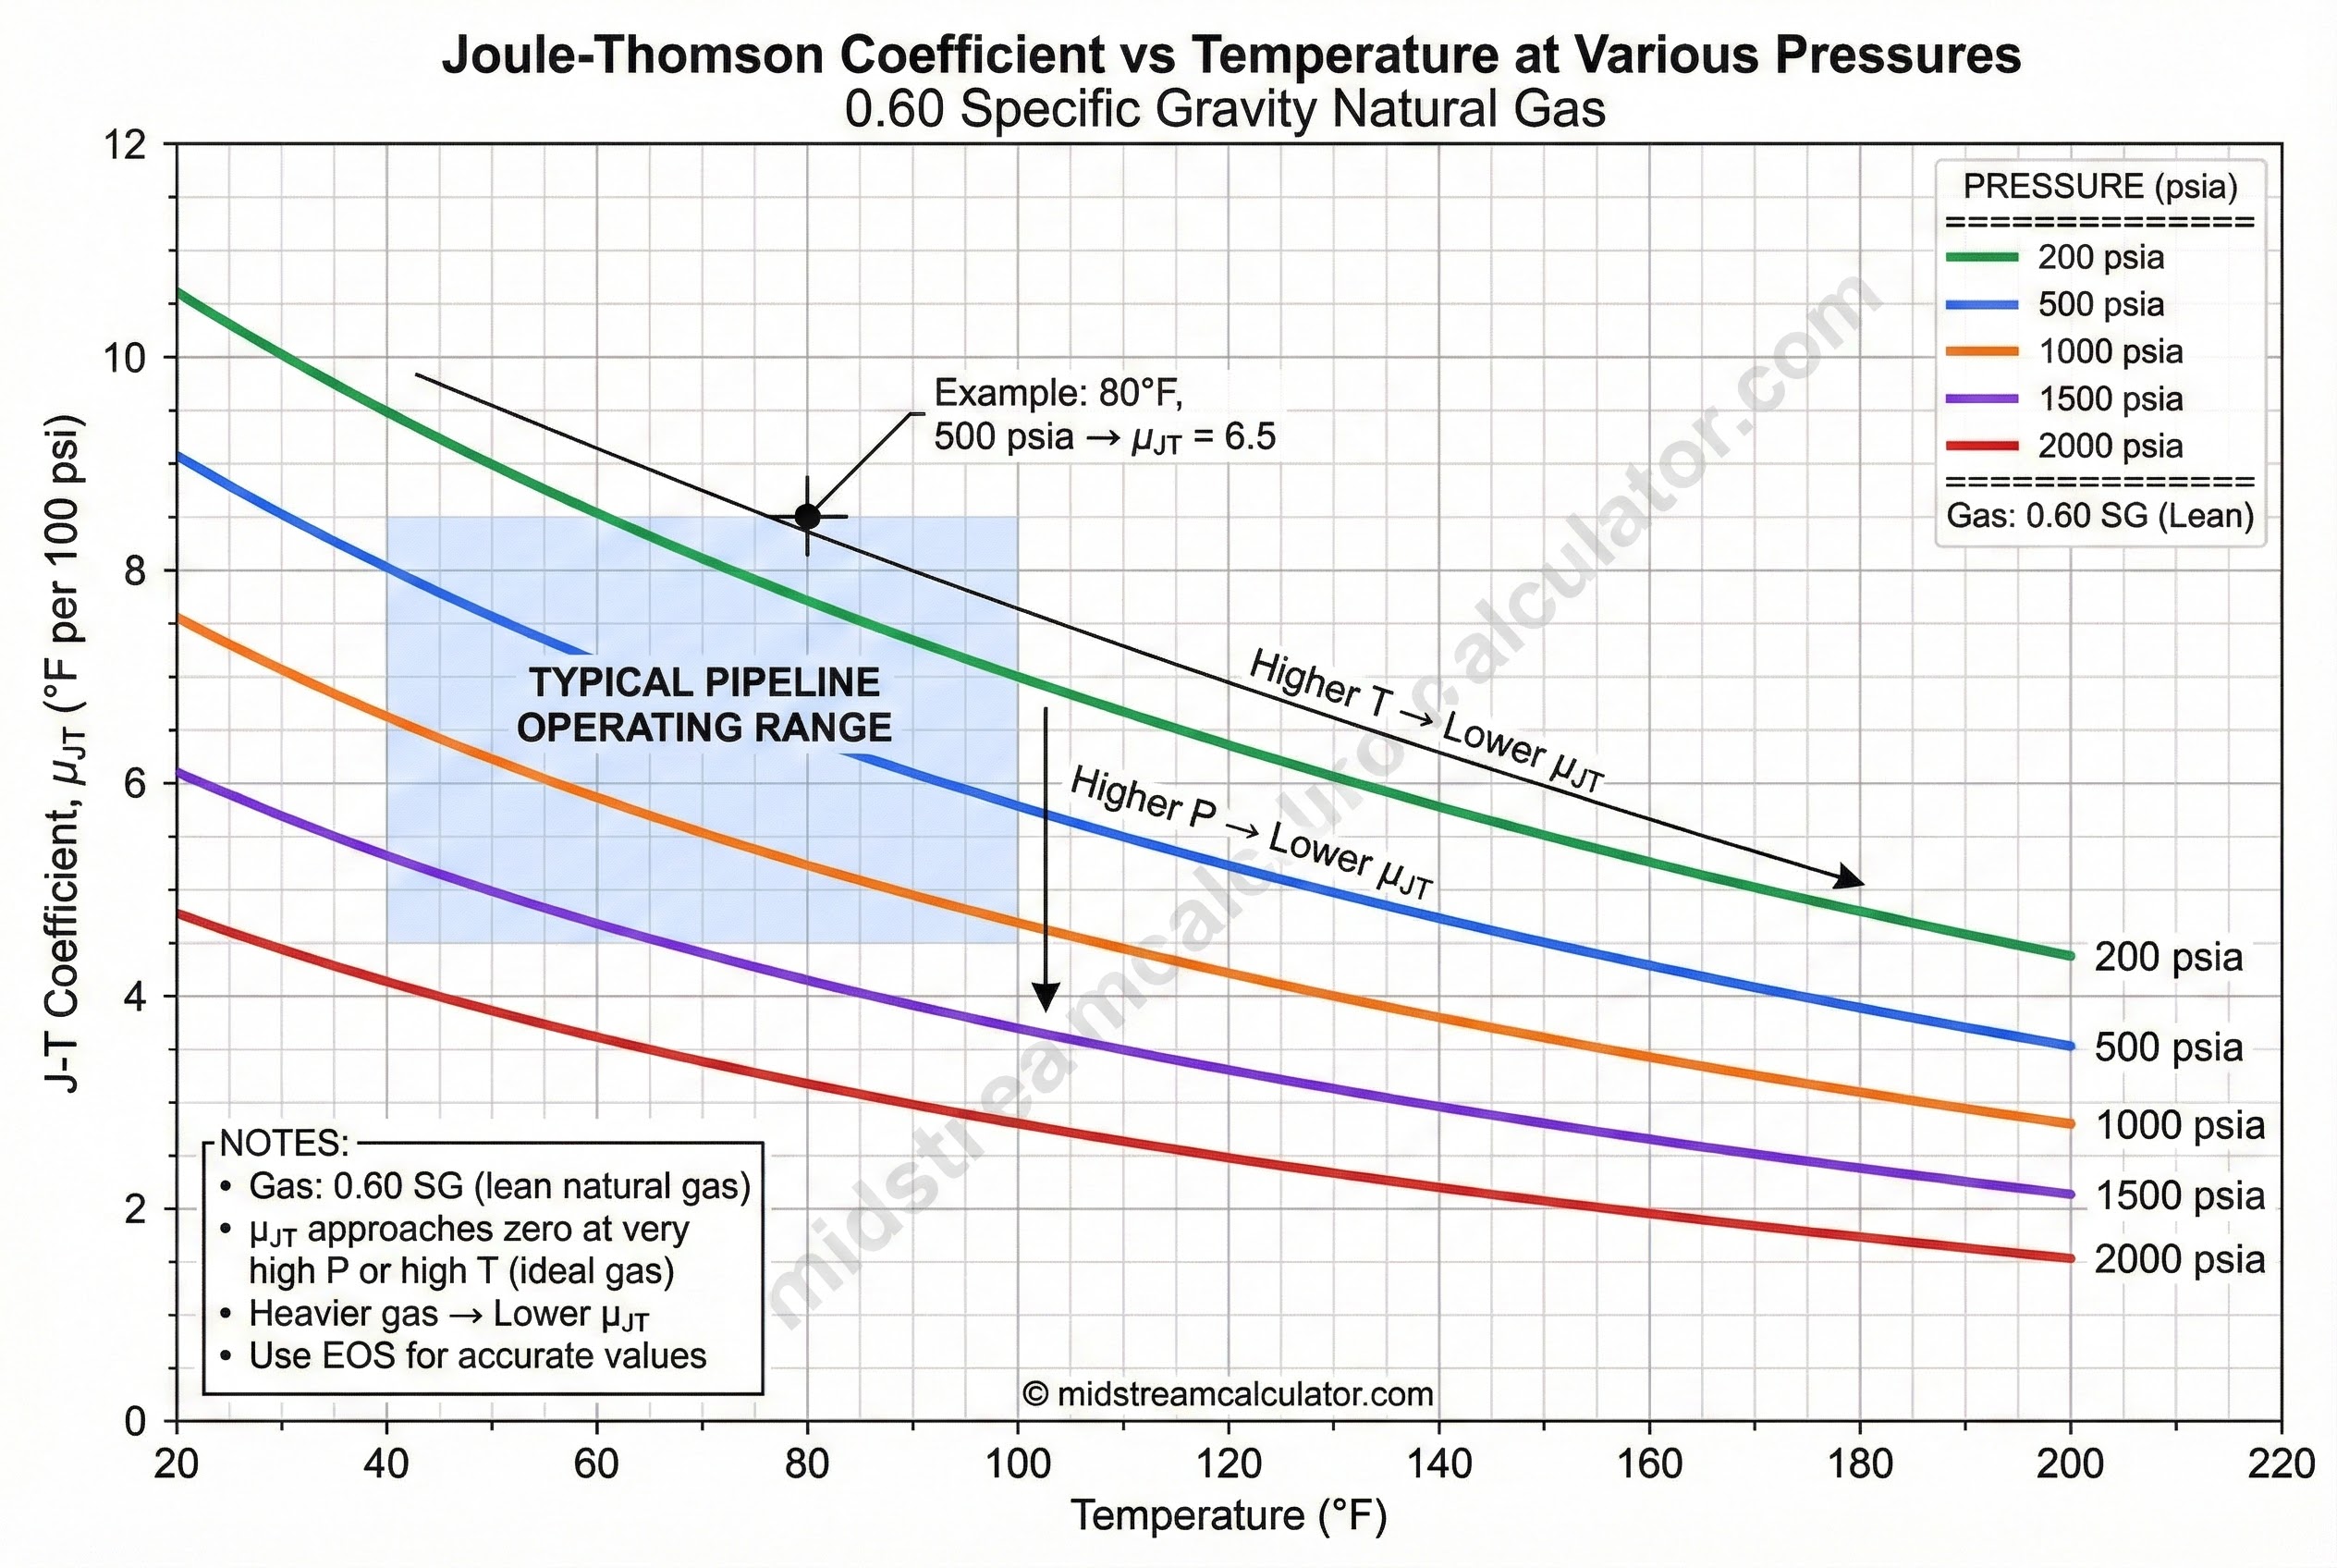
Coefficient varies with gas composition, temperature, and pressure. Heavier gas = lower μ_JT = less cooling.
Coefficient by Gas Type
| Gas Type | SG | μ_JT (°F/100 psi) | ΔT for 500 psi drop |
|---|---|---|---|
| Pure Methane | 0.55 | 6.5–7.0 | 32–35°F |
| Lean Gas | 0.60 | 6–8 | 30–40°F |
| Medium Gas | 0.70 | 5–7 | 25–35°F |
| Rich Gas | 0.80 | 4–6 | 20–30°F |
| Very Rich / NGL | 0.90+ | 3–5 | 15–25°F |
Conditions: ~80°F, 500-1000 psia. Use EOS for accurate values.
Rigorous Calculation Method
The calculator uses peer-reviewed correlations for professional-grade accuracy:
| Parameter | Method | Reference |
|---|---|---|
| Pseudo-critical properties | T_pc = 170.5 + 307.3×SG P_pc = 709.6 - 58.7×SG |
Sutton (1985) SPE 14265 |
| J-T coefficient | f(P_r,T_r) × (T_pc/P_pc) × (1/C_p) | ACS Omega (2021) |
| Hydrate temperature | Katz + Towler-Mokhatab averaged | Katz (1945), Towler (2005) |
| Large pressure drops | Step-wise integration (ΔP > 150 psi) | Accounts for varying μ_JT |
Accuracy: J-T coefficient ±5-10%, Hydrate temperature ±2-4°F for SG 0.55-0.90, P 100-2000 psia. For critical/safety applications, verify with process simulator (HYSYS, ProMax) using rigorous EOS.
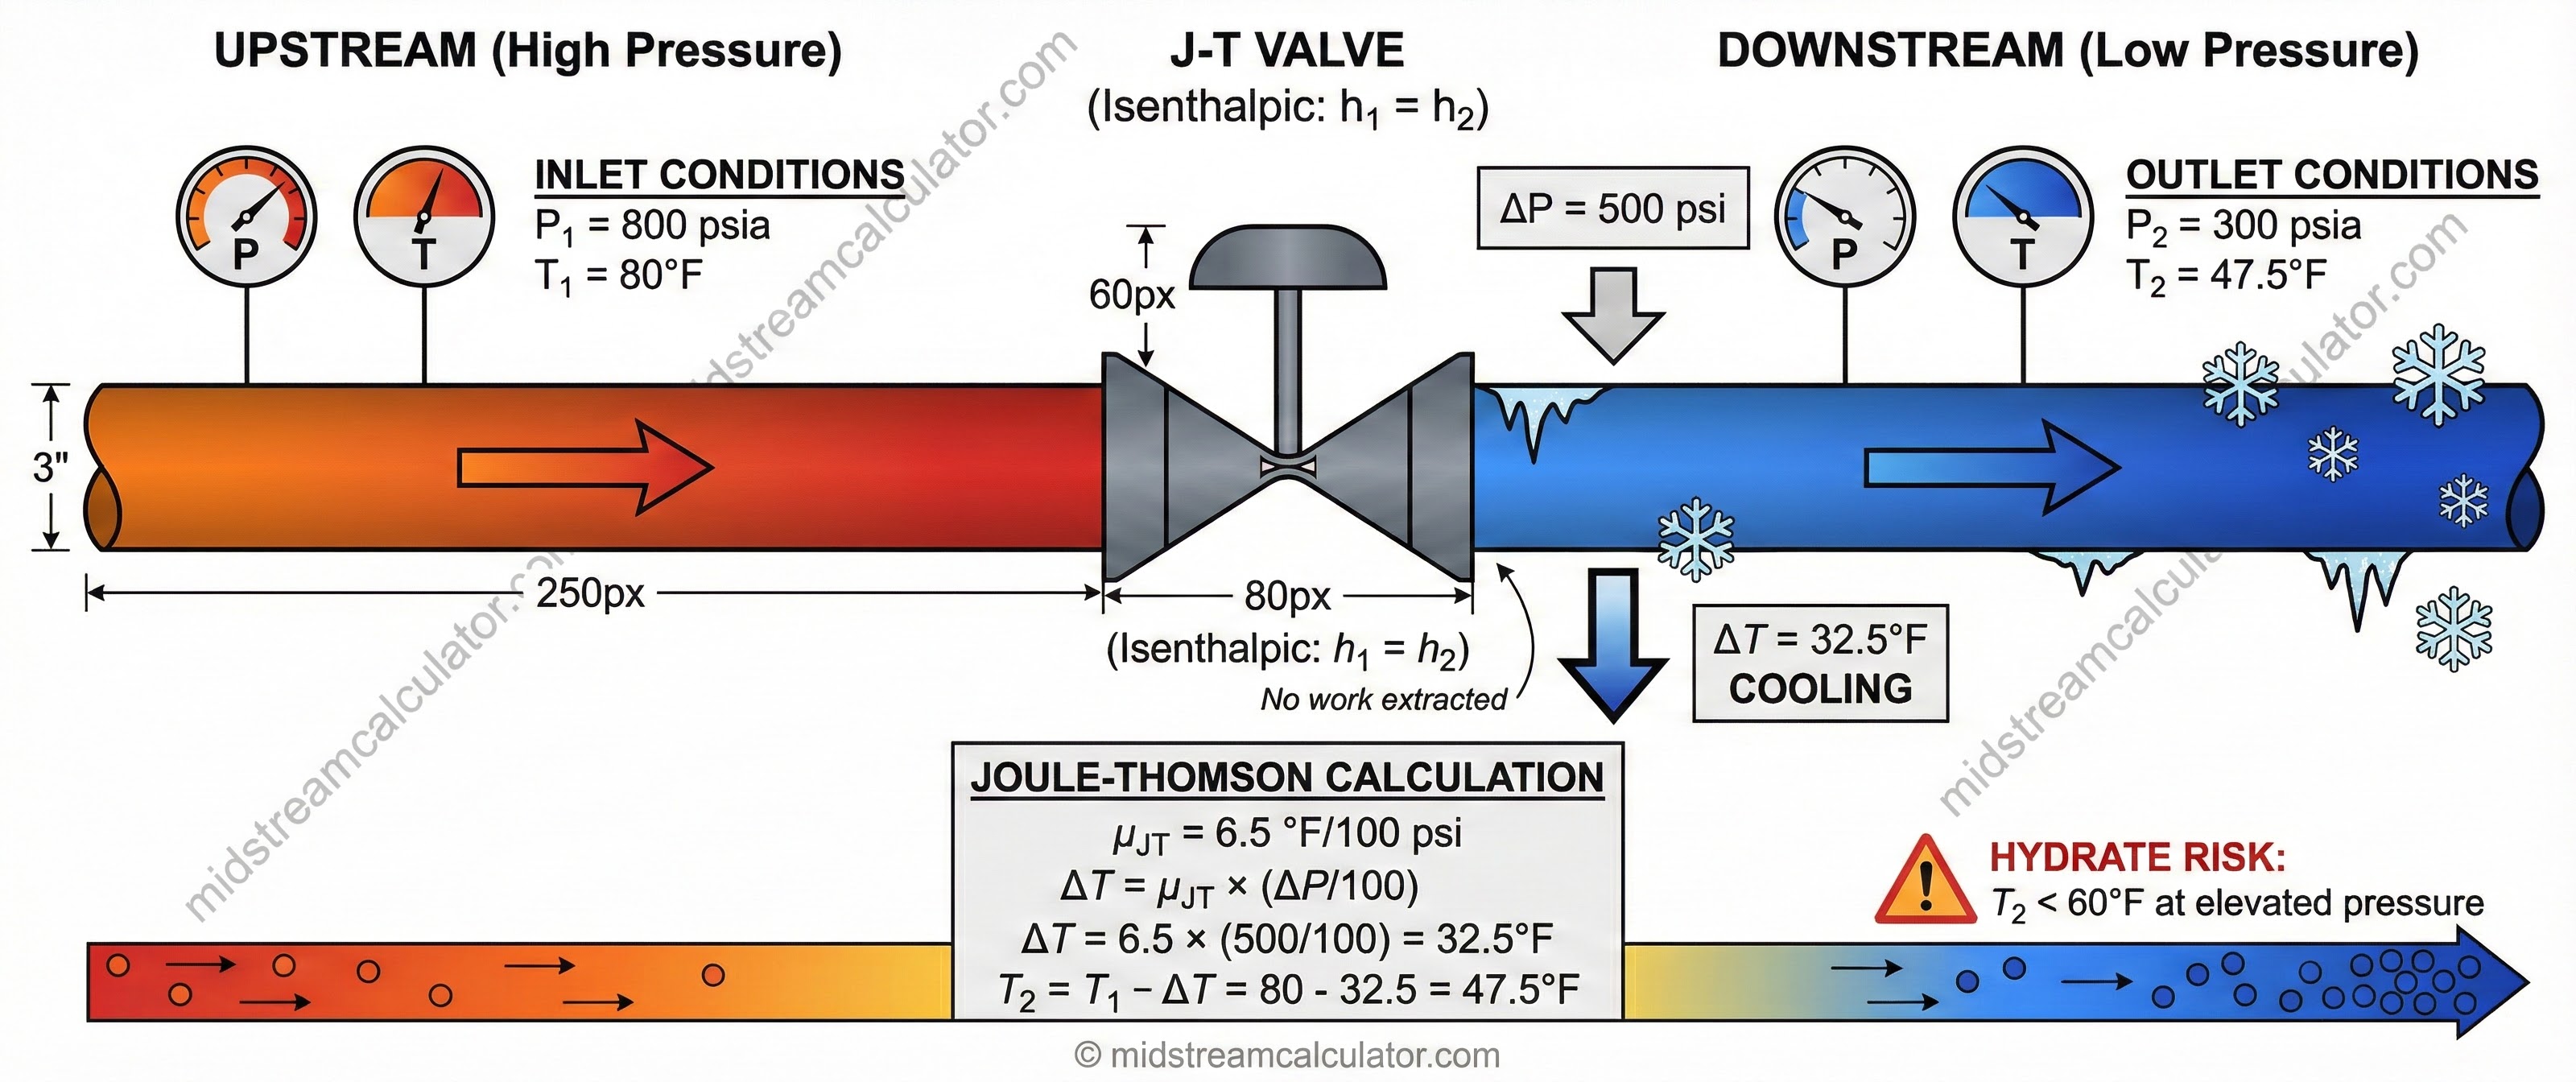
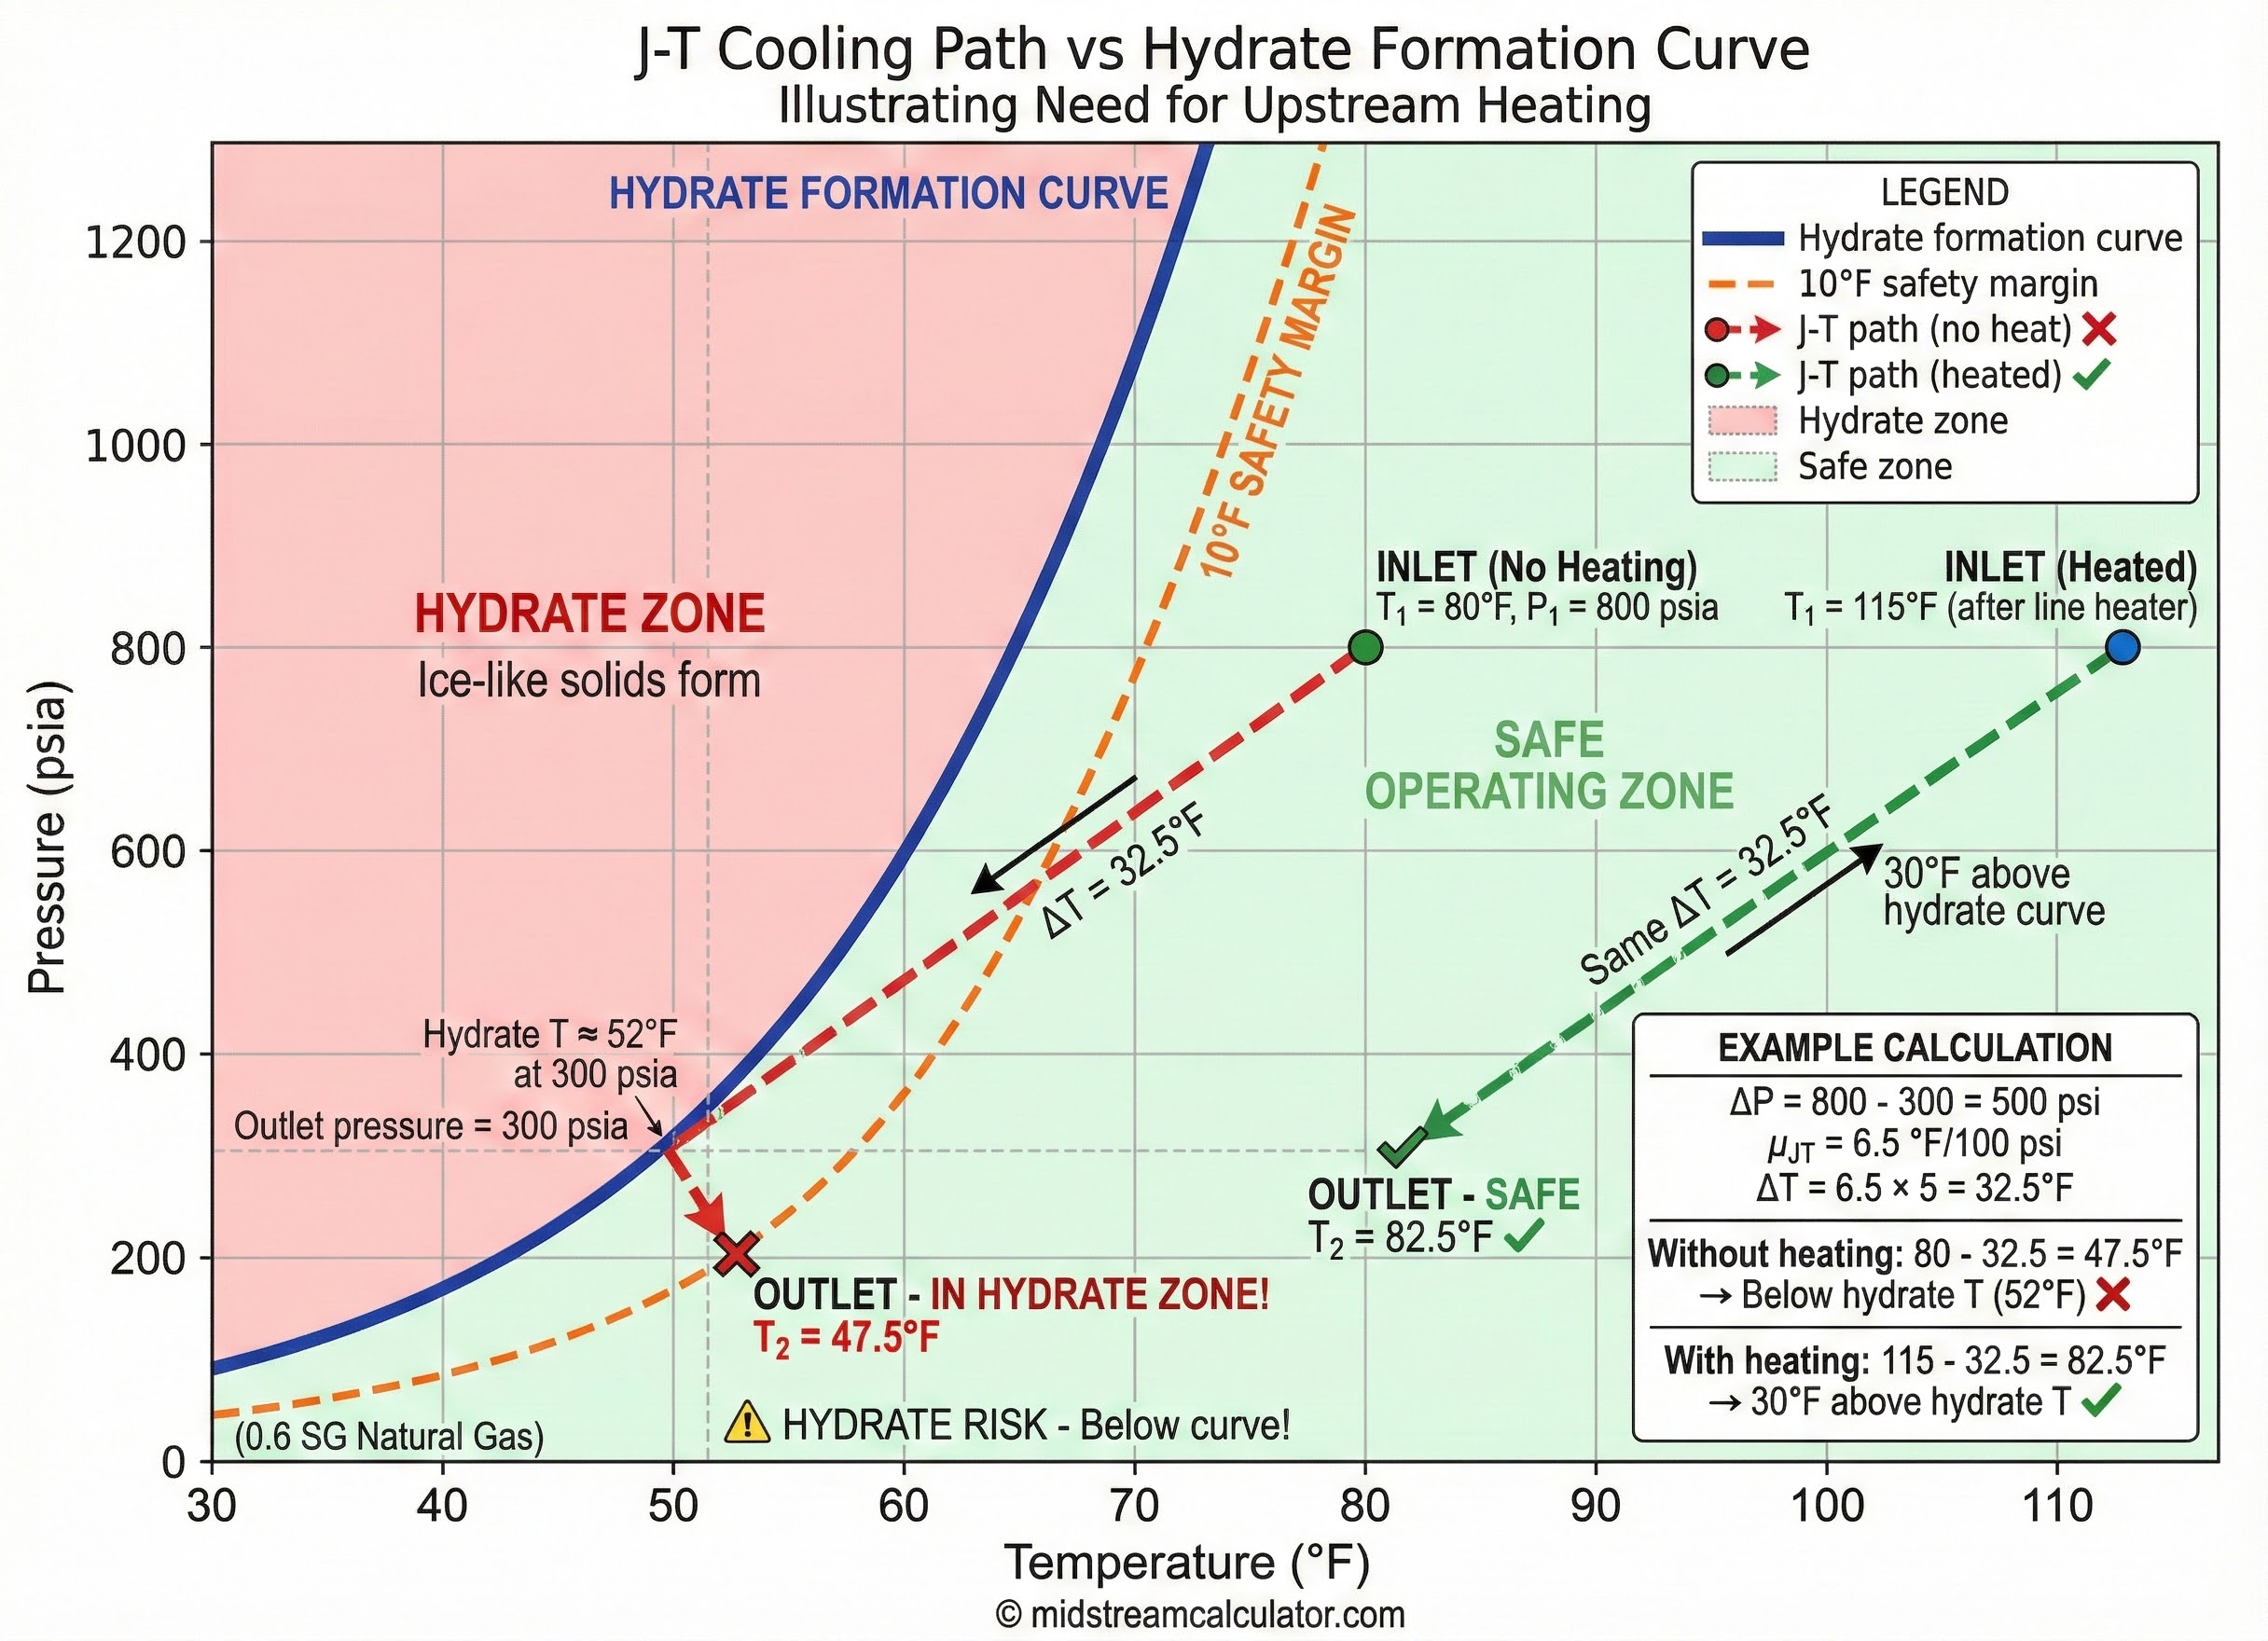
Example Calculation
3. Hydrate Risk Assessment
J-T cooling often drops gas temperature into hydrate formation zone. Always check outlet temperature against hydrate curve.
Hydrate Temperature Correlations
The calculator uses two validated correlations, averaged for best accuracy:
Validation Points
| Pressure (psia) | SG | Katz | Towler-M | GPSA Chart |
|---|---|---|---|---|
| 400 | 0.65 | 50.0°F | 49.9°F | 50-54°F |
| 1000 | 0.65 | 62.0°F | 62.9°F | 60-64°F |
| 1000 | 0.70 | 64.0°F | 64.4°F | 62-66°F |
Prevention Methods
| Method | Application | Notes |
|---|---|---|
| Dehydration | Plants, pipelines | <7 lb/MMSCF (glycol); <1 ppm (mol sieve for cryo) |
| Upstream heating | Pressure letdown | Line heater before valve |
| Methanol injection | Wellheads, intermittent | 20-50 wt% in water; high vapor losses |
| MEG injection | Subsea, continuous | 50-80 wt%; regenerable |
| LDHI | Subsea tiebacks | Kinetic/AA; 0.5-2 wt% |
⚠ Design rule: Outlet temperature must be ≥10°F above hydrate formation temperature at outlet pressure. If not, apply mitigation.
4. Applications & Design
Common Applications
| Application | Typical ΔP | ΔT (approx) | Mitigation |
|---|---|---|---|
| NGL plant inlet | 200-400 psi | 15-30°F | Gas/gas exchanger pre-cool |
| Wellhead choke | 1000-3000 psi | 60-200°F | Multi-stage, heating, MeOH |
| Pipeline letdown | 400-800 psi | 25-50°F | Line heater, dehydration |
| Fuel gas regulation | 100-300 psi | 8-20°F | Often none if dehydrated |
Design Procedure
- Get μ_JT from composition, T₁, P₁ (use EOS or chart)
- Calculate ΔT = μ_JT × ΔP (integrate for large ΔP)
- Determine T₂ = T₁ - ΔT
- Compare T₂ to hydrate curve at P₂
- Apply mitigation if margin < 10°F
Common Errors
- Constant μ_JT: Coefficient varies with T and P. Integrate for ΔP > 300 psi.
- "Dry" gas assumption: Gas at 7 lb/MMSCF still forms hydrates if cooled below dew point.
- Ignoring ambient losses: Exposed piping adds cooling beyond J-T effect.
- Material limits: A106-B steel limited to -20°F; use impact-tested steel below.
References
- Sutton, R.P. (1985). "Compressibility Factors for High-Molecular-Weight Reservoir Gases." SPE 14265.
- ACS Omega (2021). "Influences of Hydrogen Blending on the Joule-Thomson Coefficient of Natural Gas." doi:10.1021/acsomega.1c00248
- Katz, D.L. (1945). "Prediction of Conditions for Hydrate Formation in Natural Gases." Trans. AIME, 160, 140-149.
- Towler, B. & Mokhatab, S. (2005). "Quickly Estimate Hydrate Formation Conditions in Natural Gases." Hydrocarbon Processing, 84:61-62.
- GPSA, Sections 13 & 20
- Campbell Gas Conditioning and Processing, Vol. 2
Ready to use the calculator?
→ Launch Calculator