1. Overview
Gas velocity determines pipe erosion, noise, pressure drop, and liquid carryover. Pipeline diameter selection balances capital cost (smaller pipe) against operating constraints.
Velocity Calculation
Gas Velocity from Flow Rate:
v = Qactual / A
Where:
v = Gas velocity (ft/s)
Qactual = Volumetric flow at operating P,T,Z (ft³/s)
A = Pipe cross-sectional area = π D² / 4 (ft²)
Converting standard to actual flow:
Qactual = Qstd × (Pstd/P) × (T/Tstd) × Z
Standard conditions: 14.73 psia, 60°F (520°R)
Velocity Limits by Service
| Service Type | Typical Range (ft/s) | Design Consideration |
|---|---|---|
| Gathering Lines | 15-50 | May contain liquids/sand |
| Transmission Lines | 20-60 | Optimize pressure drop |
| Distribution Mains | 10-40 | Lower pressure systems |
| Compressor Suction | 20-40 | Minimize pulsation |
| Compressor Discharge | 30-60 | Higher pressure allows higher V |
| Plant Piping | 30-80 | Short runs, ΔP less critical |
| Flare Headers | 40-100 | Emergency, short duration |
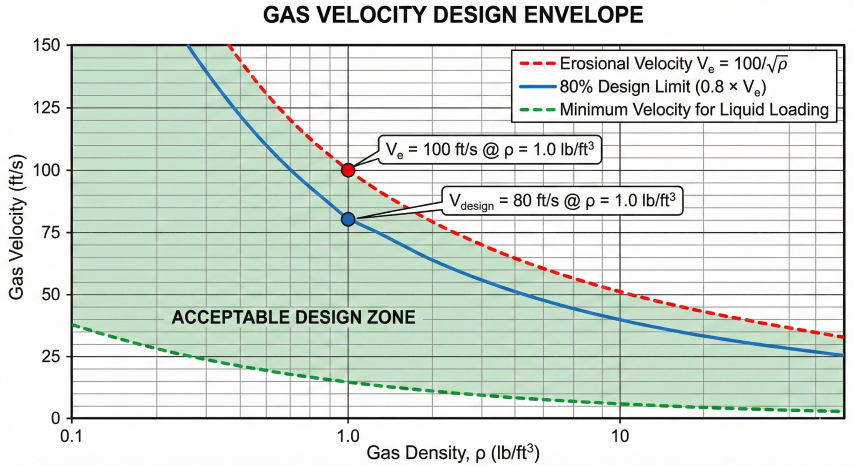
Design Philosophy: For most applications, design at 80% of erosional velocity to provide margin for flow surges and measurement uncertainty. Check minimum velocity for wet gas to prevent liquid accumulation.
2. Erosional Velocity (API RP 14E)
API Recommended Practice 14E provides the industry-standard empirical equation for maximum gas velocity to prevent erosion-corrosion in piping systems.
API RP 14E Erosional Velocity:
Ve = C / √ρ
Where:
Ve = Erosional velocity (ft/s)
C = Empirical constant (see table below)
ρ = Gas density at flowing conditions (lb/ft³)
C-Factor Selection
| Service Condition | C (US units) | Application |
|---|---|---|
| Continuous, standard service | 100 | Normal pipeline operation |
| Intermittent service (<8 hr/day) | 125 | Blowdown, purge lines |
| Clean, non-corrosive, inhibited | 150 | Sweet, dry gas systems |
| Corrosive service (CO₂, H₂S) | 75-100 | Sour gas, wet CO₂ |
| Sand-laden gas | 50-75 | Sand production, erosive |
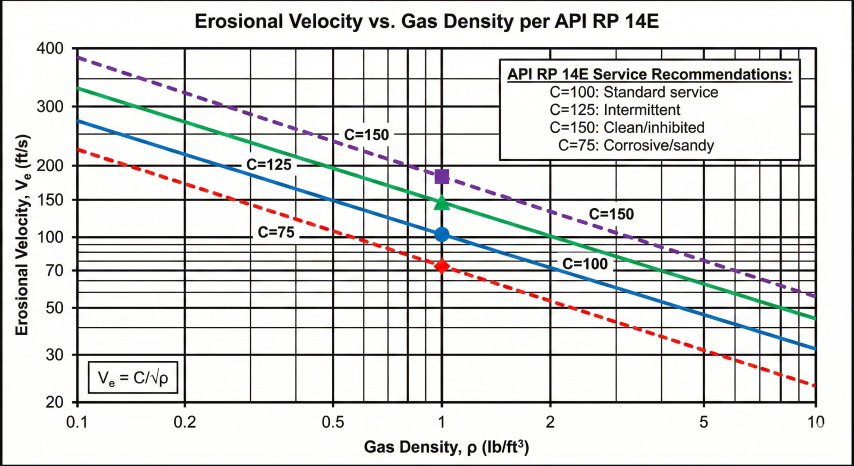
Quick Reference Table
| ρ (lb/ft³) | Ve @ C=100 | Ve @ C=125 | Ve @ C=150 |
|---|---|---|---|
| 0.5 | 141 ft/s | 177 ft/s | 212 ft/s |
| 1.0 | 100 ft/s | 125 ft/s | 150 ft/s |
| 2.0 | 71 ft/s | 88 ft/s | 106 ft/s |
| 3.0 | 58 ft/s | 72 ft/s | 87 ft/s |
| 5.0 | 45 ft/s | 56 ft/s | 67 ft/s |
API RP 14E Limitations
- Empirical basis: Derived from 1970s field experience, not rigorous physics
- Conservative: Many systems operate safely above Ve
- Does not account for: Particle size, pipe material, liquid loading
- For critical applications: Use CFD or detailed erosion models (DNV, E/CRC)
Best Practice: Use C = 100 for initial design. Apply 0.8 safety factor (design at 80% of Ve). For sandy or corrosive service, reduce C-factor appropriately.
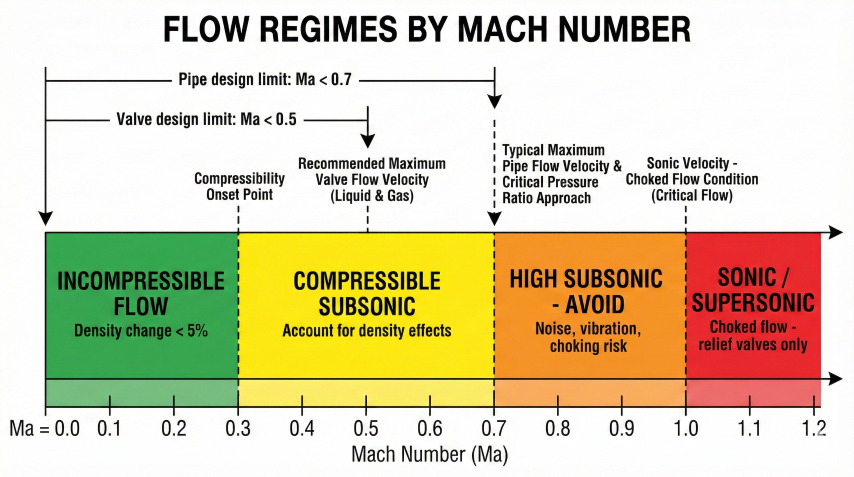
3. Sonic Velocity & Mach Number
When gas velocity approaches the speed of sound, compressible flow effects dominate. At Mach 1.0, flow is choked—further pressure reduction cannot increase flow rate.
Speed of Sound in Gas:
a = 223.0 × √(k × T / MW) [ft/s]
Where:
a = Sonic velocity (ft/s)
k = Isentropic exponent (Cp/Cv)
T = Temperature (°R)
MW = Molecular weight (lb/lbmol)
223.0 = √(gc × R) = √(32.174 × 1545.35)
Mach Number:
Ma = v / a
Natural gas (SG ≈ 0.65): k ≈ 1.285, MW ≈ 18.8
At 60°F: a ≈ 1,330 ft/s
Mach Number Design Limits
| Application | Max Ma | Reason |
|---|---|---|
| Straight pipe (long runs) | 0.7 | Avoid noise, vibration, excessive ΔP |
| Valves and fittings | 0.6 | Prevent local choking |
| Control valves | 0.3-0.5 | Maintain control stability |
| Pressure relief valves | 1.0 | Designed for choked flow |
| Flare headers | 0.5 | Avoid back pressure issues |
Sonic Velocity vs Temperature
| Temperature | Natural Gas (ft/s) | 70% of Sonic (ft/s) |
|---|---|---|
| 0°F | 1,249 | 875 |
| 60°F | 1,328 | 930 |
| 100°F | 1,379 | 965 |
| 150°F | 1,439 | 1,007 |
Practical Note: For most pipeline velocities (30-80 ft/s), Mach number is typically 0.02-0.06—well below the 0.7 limit. Sonic velocity is rarely governing for pipelines but is critical for control valves and restrictions.
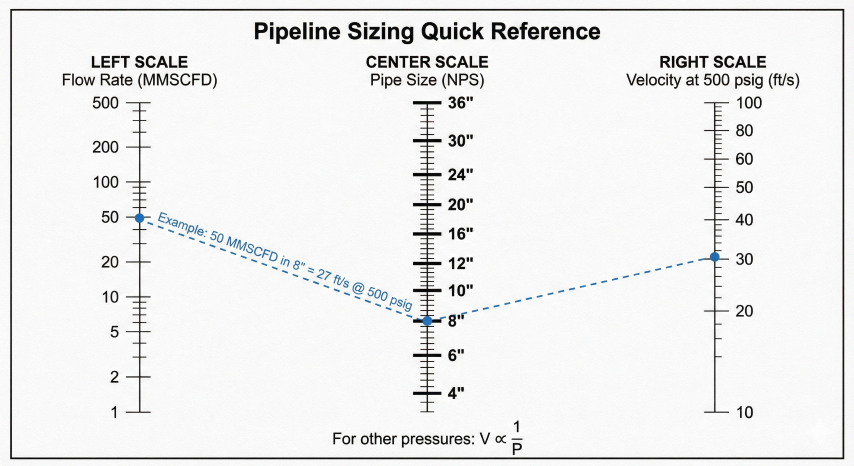
4. Pipeline Sizing Criteria
Sizing Workflow
Step 1: Calculate gas density at operating conditions
ρ = (SG × 0.0765 × P × 520) / (14.73 × T × Z) [lb/ft³]
Step 2: Calculate erosional velocity
Ve = C / √ρ
Step 3: Set design velocity
Vdesign = 0.8 × Ve (80% safety factor)
Step 4: Calculate minimum diameter
D = √(4 × Qactual / (π × Vdesign)) × 12 [inches]
Step 5: Select next larger standard pipe size
NPS options: 2, 3, 4, 6, 8, 10, 12, 14, 16, 18, 20, 24, 30, 36...
Step 6: Verify actual velocity and Mach number
Standard Pipe Sizes (NPS)
| NPS | Sch 40 ID (in) | Area (in²) |
|---|---|---|
| 4" | 4.026 | 12.73 |
| 6" | 6.065 | 28.89 |
| 8" | 7.981 | 50.03 |
| 10" | 10.020 | 78.85 |
| 12" | 11.938 | 111.9 |
| 16" | 15.000 | 176.7 |
| 20" | 19.000 | 283.5 |
| 24" | 23.000 | 415.5 |
Liquid Loading Velocity
In wet gas systems, minimum velocity is required to carry liquid droplets and prevent accumulation:
Turner Correlation (Critical Velocity for Liquid Loading):
Vcritical = 1.593 × σ0.25 × (ρL - ρG)0.25 / ρG0.5
For water in natural gas (simplified):
Vcritical ≈ 11.5 / √ρG [ft/s]
Compare to erosional: Ve = C/√ρ = 100/√ρ
At low pressure (low ρ): Erosional velocity governs
At high pressure (high ρ): Liquid loading may govern
Economic Optimization: For long transmission lines, economic velocity (30-50 ft/s) may be lower than erosional limit. Balance pipe capital cost against compression operating cost over project life.
5. Design Examples
Example 1: Gathering Line Velocity Check
Given:
Q = 10 MMSCFD, D = 6" (ID = 6.065"), P = 400 psig, T = 80°F
SG = 0.70, Z = 0.95
Step 1: Calculate gas density
Pabs = 400 + 14.7 = 414.7 psia
T = 80 + 460 = 540°R
ρ = (0.70 × 0.0765 × 414.7 × 520) / (14.73 × 540 × 0.95)
ρ = 1.53 lb/ft³
Step 2: Calculate erosional velocity (C = 100)
Ve = 100 / √1.53 = 80.8 ft/s
Vdesign = 0.8 × 80.8 = 64.7 ft/s
Step 3: Calculate actual velocity
Qactual = 10 × 10⁶ / 86400 × (14.73/414.7) × (540/520) × 0.95
Qactual = 4.06 ft³/s
A = π × (6.065/12)² / 4 = 0.201 ft²
V = 4.06 / 0.201 = 20.2 ft/s
Result: V = 20.2 ft/s < 64.7 ft/s ✓ (25% of erosional)
Example 2: Size Pipe for Target Velocity
Given:
Q = 50 MMSCFD, P = 800 psig, T = 70°F
SG = 0.65, Z = 0.88, Target velocity = 40 ft/s
Step 1: Calculate actual flow rate
Pabs = 814.7 psia, T = 530°R
Qstd = 50 × 10⁶ / 86400 = 578.7 scfs
Qactual = 578.7 × (14.73/814.7) × (530/520) × 0.88
Qactual = 9.38 ft³/s
Step 2: Calculate required area
A = Q / V = 9.38 / 40 = 0.235 ft² = 33.8 in²
Step 3: Calculate diameter
D = √(4 × 33.8 / π) = 6.56 inches
Step 4: Select next standard size
Select 8" pipe (ID = 7.981")
Actual A = 50.03 in² = 0.347 ft²
Actual V = 9.38 / 0.347 = 27.0 ft/s
Step 5: Verify erosional limit
ρ = 3.07 lb/ft³
Ve = 100 / √3.07 = 57.1 ft/s
V / Ve = 27.0 / 57.1 = 47% ✓
Common Design Mistakes
- Using C = 100 for all cases: Adjust for service conditions
- Ignoring liquid loading: Wet gas at low pressure needs minimum velocity
- Designing for average flow: Size for maximum anticipated flow
- Wrong gas density: Must use actual P/T conditions, not standard
- Neglecting Z-factor: High pressure gas deviates from ideal behavior
Final Check: After sizing, verify: (1) V < 0.8 × Ve, (2) V > Vcritical if wet gas, (3) Ma < 0.7, (4) ΔP acceptable. Document all assumptions.
Ready to use the calculator?
→ Launch Calculator