Compare natural gas and diesel fuel costs on an energy-equivalent basis, calculate engine efficiency differences, perform economic breakeven analysis, and evaluate total operating costs for compressors and generators.
Compare fuel costs for compressors and generators.
Calculate breakeven gas price vs diesel.
Evaluate conversion from diesel to natural gas fuel.
1. Overview & Applications
Natural gas and diesel are the two dominant fuels for midstream compression, power generation, and drilling operations. Fuel selection and cost comparison require understanding energy equivalency, engine efficiency differences, capital costs, and operational factors beyond simple price per unit.
Pipeline compression
Gas vs diesel drives
Gas engines dominate transmission pipelines; diesel for remote portable units.
Power generation
Wellsite and facilities
Remote wellsites use diesel gensets; large facilities use gas turbines or engines.
Drilling rigs
Fuel switching economics
Drilling rig conversion to dual-fuel or gas-only saves $50-200k/well.
Emissions compliance
Air quality considerations
Natural gas has lower NOx, PM, and CO₂ emissions than diesel per Btu.
Key Concepts
Energy equivalency: Converting volume units (scf, gallons) to common energy basis (Btu, MJ)
Higher heating value (HHV): Total energy including water vapor condensation heat
Brake thermal efficiency: Ratio of shaft power output to fuel energy input
Fuel energy ratio (FER): Relative fuel consumption accounting for efficiency differences
Levelized cost of energy (LCOE): Total cost per unit energy delivered over asset life
Why fuel economics matter: A 2,000 HP compressor operating 8,000 hours/year at 80% load consumes $400,000-800,000 in fuel annually. A 5% fuel cost advantage saves $20,000-40,000/year. Over a 20-year asset life, this is $400,000-800,000 NPV at 8% discount rate.
2. Energy Content Equivalency
Natural gas and diesel have different energy densities. Direct cost comparison requires converting both fuels to a common energy basis, typically Btu (US) or MJ (SI).
Fuel Heating Values
Natural Gas (typical pipeline quality):
Higher Heating Value (HHV): 1,020 Btu/scf (range: 950-1,150)
Lower Heating Value (LHV): 920 Btu/scf (range: 850-1,050)
HHV basis includes heat from water vapor condensation (standard in US)
LHV basis excludes condensation heat (common in Europe)
No. 2 Diesel Fuel:
Higher Heating Value (HHV): 138,500 Btu/gallon (typical)
Lower Heating Value (LHV): 130,500 Btu/gallon (typical)
Range: 137,000-140,000 Btu/gal (HHV) depending on specific gravity
Density and mass-based heating value:
Diesel density: 7.0-7.3 lb/gal (specific gravity 0.84-0.87)
Mass heating value: 19,000-19,500 Btu/lb (HHV)
Volumetric Energy Equivalency
Gas-to-Diesel Volume Ratio (HHV basis):
scf gas per gallon diesel = HHV_diesel / HHV_gas
For typical values:
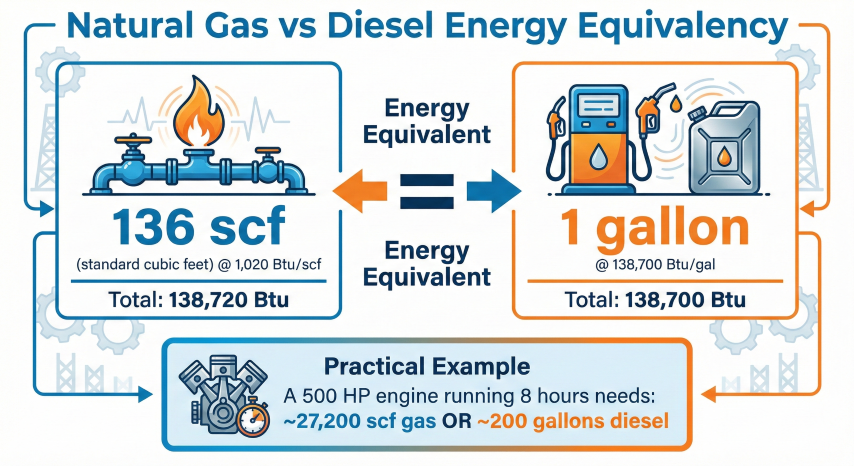
scf/gal = 138,500 Btu/gal / 1,020 Btu/scf = 135.8 scf/gal
Rounded: ~136 scf ≈ 1 gallon diesel (energy equivalent)
Or inverted:
1,000 scf gas ≈ 7.35 gallons diesel
In practice, use rule of thumb:
1,000 scf gas ≈ 1 Mcf ≈ 7-8 gallons diesel (energy basis)
This is approximate because:
- Gas HHV varies 950-1,150 Btu/scf (composition dependent)
- Diesel HHV varies 137,000-140,000 Btu/gal (grade dependent)
Energy Cost Comparison
Cost per Million Btu ($/MMBtu):
For natural gas:
Cost_MMBtu = (Price_$/Mscf / HHV_Btu/scf) × 1,000,000
For gas at $3.00/Mscf, HHV = 1,020 Btu/scf:
Cost = ($3.00 / 1,020) × 1,000,000 = $2.94/MMBtu
For diesel:
Cost_MMBtu = (Price_$/gal / HHV_Btu/gal) × 1,000,000
For diesel at $3.50/gal, HHV = 138,500 Btu/gal:
Cost = ($3.50 / 138,500) × 1,000,000 = $25.27/MMBtu
Ratio:
Diesel is 25.27 / 2.94 = 8.6× more expensive per Btu than gas in this example.
However, diesel engines are more efficient, so delivered energy cost ratio is lower.
Energy equivalency between natural gas and diesel fuel. Approximately 136 scf of pipeline-quality gas equals 1 gallon diesel on a heating value basis.
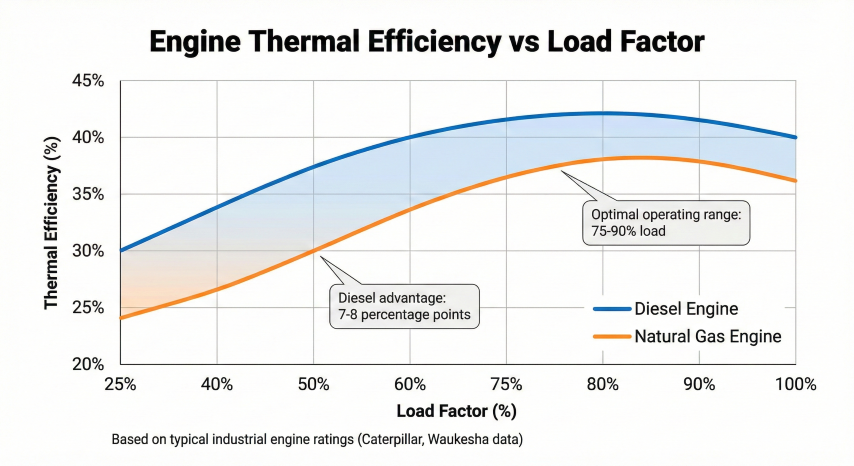
Diesel and natural gas engines have different brake thermal efficiencies due to combustion characteristics, compression ratios, and operating cycles. This significantly affects fuel consumption for the same power output.
Diesel engines maintain a 5-10 percentage point efficiency advantage over natural gas engines across all load factors. Both engine types peak in efficiency at 75-90% load.
Typical Engine Efficiencies
Engine Type
Thermal Efficiency (HHV)
Typical Size Range
Applications
Diesel engine (4-stroke)
35-42%
100-5,000 HP
Portable compression, remote power
Natural gas engine (4-stroke rich-burn)
28-35%
300-5,000 HP
Pipeline compression (older units)
Natural gas engine (4-stroke lean-burn)
32-38%
500-5,000 HP
Pipeline compression (modern)
Dual-fuel diesel/gas (80% gas, 20% diesel pilot)
33-40%
500-3,000 HP
Drilling rigs, flexible fuel sourcing
Gas turbine (simple cycle)
25-35%
3,000-40,000 HP
Large pipeline stations, LNG
Gas turbine (combined cycle)
45-55%
50+ MW electric
Power plants (not typical midstream)
Fuel Consumption Equations
Brake Thermal Efficiency:
η_thermal = (Brake Power Output) / (Fuel Energy Input)
η_thermal = HP_brake × 2545 Btu/hr per HP / (Fuel_rate × HHV)
Or rearranged to find fuel rate:
Fuel_rate = (HP_brake × 2545) / (η_thermal × HHV)
For natural gas (scf/hr):
scf/hr = (HP_brake × 2545) / (η_thermal × HHV_Btu/scf)
For 1,000 HP engine, η = 35%, HHV = 1,020 Btu/scf:
scf/hr = (1,000 × 2,545) / (0.35 × 1,020) = 7,126 scf/hr
For diesel (gal/hr):
gal/hr = (HP_brake × 2545) / (η_thermal × HHV_Btu/gal)
For 1,000 HP engine, η = 40%, HHV = 138,500 Btu/gal:
gal/hr = (1,000 × 2,545) / (0.40 × 138,500) = 45.9 gal/hr
Efficiency Impact on Fuel Ratio
Fuel Energy Ratio (FER):
FER = (Gas consumption / Diesel consumption) × (efficiency adjustment)
FER = (scf/hr / gal/hr) × (η_diesel / η_gas) × (HHV_diesel / HHV_gas)
Simplifies to:
FER = (HHV_diesel / HHV_gas) × (η_diesel / η_gas)
Example:
HHV_diesel / HHV_gas = 138,500 / 1,020 = 135.8 scf/gal (energy basis)
η_diesel / η_gas = 40% / 35% = 1.143
FER = 135.8 × 1.143 = 155.2 scf per gallon diesel (efficiency-adjusted)
Interpretation:
On an equivalent work output basis, 155 scf of gas in a gas engine produces
the same shaft power as 1 gallon diesel in a diesel engine.
Or: 1,000 scf gas ≈ 6.45 gallons diesel (work equivalent)
This is less than the 7.35 gallon energy equivalency due to diesel's
higher efficiency.
Worked Example: Fuel Consumption Comparison
Compare fuel costs for a 2,000 HP compressor operating 8,000 hours/year at 85% average load:
Ambient temperature: High altitude and hot weather reduce power output 3-5% per 1,000 ft elevation and 1% per 10°F above 60°F
Engine age and maintenance: Worn engines lose 5-10% efficiency over 20+ years without overhaul
Part-load operation: Engines are least efficient at <40% load; efficiency peaks at 75-90% load
Air-fuel ratio: Rich-burn gas engines (stoichiometric) have lower efficiency than lean-burn but simpler emissions control
4. Economic Breakeven Analysis
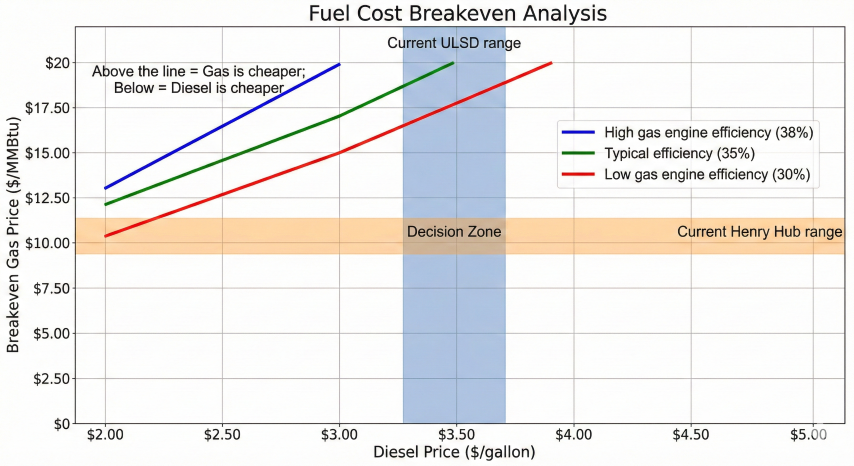
Breakeven analysis determines the natural gas price at which fuel costs are equivalent between gas and diesel, accounting for efficiency differences. This is critical for fuel switching decisions and contract negotiations.
Example 1: Modern lean-burn gas vs diesel
Given:
P_diesel = $3.50/gal
HHV_gas = 1,020 Btu/scf
HHV_diesel = 138,500 Btu/gal
η_gas = 37% (modern lean-burn)
η_diesel = 40%
P_gas_BE = 3.50 × (1,020 / 138,500) × (0.37 / 0.40) × 1000
P_gas_BE = 3.50 × 0.007363 × 0.925 × 1000
P_gas_BE = $23.85/Mscf
Interpretation:
If natural gas costs less than $23.85/Mscf (very high!), gas is cheaper
on a delivered energy basis. In practice, gas is almost always cheaper.
Example 2: Older rich-burn gas vs diesel
η_gas = 32% (older rich-burn), other parameters same:
P_gas_BE = 3.50 × (1,020 / 138,500) × (0.32 / 0.40) × 1000
P_gas_BE = $20.62/Mscf
Lower gas engine efficiency reduces breakeven price, making gas less
economically competitive (but still far cheaper than diesel at typical prices).
Breakeven gas price chart showing at what natural gas price the fuel costs equal diesel. At typical prices ($3.50/gal diesel, $3.50/Mcf gas), natural gas is significantly cheaper.
Breakeven gas price is sensitive to several parameters:
Sensitivity to efficiency:
∂P_gas / ∂η_gas = P_diesel × (HHV_gas / HHV_diesel) × (1 / η_diesel) × 1000
For P_diesel = $3.50/gal, η_diesel = 40%:
∂P_gas / ∂η_gas = 3.50 × (1,020 / 138,500) × (1 / 0.40) × 1000
= $64.55 per unit efficiency
If gas engine efficiency improves from 35% to 37% (+2 percentage points):
ΔP_gas_BE = 64.55 × 0.02 = $1.29/Mscf increase
Sensitivity to gas heating value:
∂P_gas / ∂HHV_gas = P_diesel × (1 / HHV_diesel) × (η_gas / η_diesel) × 1000
For lean gas (950 Btu/scf) vs rich gas (1,100 Btu/scf):
ΔP_gas_BE ≈ ±8% per 100 Btu/scf variation
Real-World Considerations
Fuel price volatility: Diesel prices are 2-3× more volatile than natural gas; gas provides more predictable operating costs
Infrastructure costs: Gas fuel requires pipeline connection (capital); diesel requires storage tanks and trucking (ongoing cost)
Emissions credits/penalties: Some jurisdictions tax diesel emissions or credit cleaner gas combustion
Dual-fuel flexibility: Dual-fuel engines allow switching based on real-time price, capturing price spreads
Typical market conditions: Natural gas prices range $2-6/Mscf while diesel ranges $2.50-4.50/gal. Even with diesel's efficiency advantage, gas is typically 70-85% cheaper on a delivered energy basis, making gas the economical choice when available.
5. Total Operating Costs
Fuel cost is only one component of total operating cost. Capital costs, maintenance, reliability, and emissions compliance all affect the economic comparison between gas and diesel prime movers.
Total Cost of Ownership (TCO) Components
Cost Category
Natural Gas Engine
Diesel Engine
Comparison
Capital cost ($/HP)
$300-500/HP
$250-400/HP
Gas +10-20% higher capex
Fuel infrastructure
$50k-500k pipeline connection
$20k-100k tank + containment
Gas higher upfront, lower ongoing
Maintenance ($/HP·yr)
$15-30/HP·yr
$20-40/HP·yr
Gas 25-40% lower maintenance
Overhaul interval
30,000-60,000 hrs
20,000-40,000 hrs
Gas longer life between overhauls
Emissions controls
$50-150k (catalyst, controls)
$100-300k (SCR, DPF for Tier 4)
Gas simpler emissions (lower NOx)
Fuel delivery
$0 (pipeline)
$0.10-0.30/gal trucking
Diesel has ongoing logistics cost
Levelized Cost of Energy (LCOE)
LCOE Formula:
LCOE = (Capital + Σ(Operating Costs / (1+r)^t)) / (Σ(Energy Output / (1+r)^t))
Where:
r = Discount rate (typically 8-12%)
t = Year of operation
Simplified annual cost approach:
Annual_cost = Capital_annualized + Fuel + Maintenance + Other
Capital_annualized = Capital × CRF
Where CRF (capital recovery factor):
CRF = [r × (1+r)^n] / [(1+r)^n - 1]
For r = 10%, n = 20 years:
CRF = 0.1175
Example: 2,000 HP compressor, 8,000 hr/yr operationNatural gas option:
Capital = 2,000 HP × $400/HP = $800,000
Infrastructure = $150,000 (gas line connection)
Total capex = $950,000
Annualized capital = $950,000 × 0.1175 = $111,600/yr
Fuel = $339,200/yr (from Section 3 example at $3.50/Mscf)
Maintenance = 2,000 HP × $20/HP·yr = $40,000/yr
Total annual cost = $111,600 + $339,200 + $40,000 = $490,800/yr
Diesel option:
Capital = 2,000 HP × $350/HP = $700,000
Infrastructure = $50,000 (tank, pump, containment)
Total capex = $750,000
Annualized capital = $750,000 × 0.1175 = $88,100/yr
Fuel = $2,186,800/yr (from Section 3 example at $3.50/gal)
Maintenance = 2,000 HP × $30/HP·yr = $60,000/yr
Fuel delivery = 624,800 gal/yr × $0.15/gal = $93,700/yr
Total annual cost = $88,100 + $2,186,800 + $60,000 + $93,700 = $2,428,600/yr
Cost comparison:
Diesel premium = $2,428,600 - $490,800 = $1,937,800/yr
Gas saves 80% annually despite higher capital cost.
Payback period for gas capex premium:
($950,000 - $750,000) / $1,937,800 = 0.10 years = 1.2 months!
Operational Factors
Non-fuel considerations that affect engine selection:
Availability and reliability: Gas engines typically achieve 95-98% availability; diesel 90-95% due to fuel system issues
Cold weather starting: Diesel better for extreme cold (< -20°F); gas requires preheating or glycol systems
Remote location fuel access: Diesel for areas without gas pipelines; gas for on-pipeline sites
Portable vs stationary: Diesel dominates portable compression (drilling, workover); gas for fixed stations
Emissions Economics
Emissions Comparison (typical, lb/MMBtu fuel input):
Natural Gas Diesel
NOx (nitrogen oxides) 0.1-0.5 1.5-3.0
CO (carbon monoxide) 0.2-0.8 0.5-1.5
PM (particulate matter) 0.01-0.05 0.2-0.5
CO₂ (carbon dioxide) 117 163
SO₂ (sulfur dioxide) 0.001 0.3-1.0
NOx penalties (where applicable):
Some air districts impose fees: $5,000-15,000 per ton NOx/year
For 2,000 HP unit burning diesel at 2.0 lb NOx/MMBtu:
Annual fuel = 2,186,800 gal × 138,500 Btu/gal / 1,000,000 = 303,000 MMBtu
NOx = 303,000 MMBtu × 2.0 lb/MMBtu = 606,000 lb = 303 tons/year
Penalty at $10,000/ton = $3,030,000/year
This can exceed fuel cost! Emissions alone justify gas in these regions.
Gas at 0.3 lb NOx/MMBtu:
NOx = 97,000 MMBtu × 0.3 = 29,100 lb = 14.6 tons/year
Penalty = $146,000/year (95% reduction vs diesel)
Decision flowchart for selecting between natural gas and diesel fuel for industrial engines. Gas availability, load factor, fuel prices, and emissions requirements drive the optimal choice.
Capital Investment Decision Tree
Simplified decision framework for fuel selection:
Decision criteria:
1. Is natural gas pipeline available within 1 mile?
- No → Diesel (gas infrastructure cost prohibitive)
- Yes → Continue to step 2
2. Will unit operate > 3,000 hours/year for > 5 years?
- No → Diesel (insufficient runtime to justify gas capex)
- Yes → Continue to step 3
3. Is natural gas price < $10/Mscf?
- No → Evaluate dual-fuel option for flexibility
- Yes → Continue to step 4
4. Are NOx emissions regulated or penalized?
- Yes → Strong preference for natural gas
- No → Mild preference for natural gas based on fuel cost
5. Is unit portable or requires frequent relocation?
- Yes → Diesel (mobility requirement)
- No → Natural gas (lowest TCO for stationary)
Result:
In most midstream applications with gas availability and high utilization,
natural gas is the economically optimal choice.
Industry trend: Midstream operators increasingly favor natural gas engines for fixed compression stations due to 70-85% lower fuel cost, 40-60% lower maintenance, and 90-95% lower NOx emissions. Diesel remains essential for portable units and gas-unavailable locations, but represents <15% of new midstream prime mover installations.
Common Pitfalls
Comparing $/gallon to $/Mscf directly: Must convert to $/MMBtu or account for energy density difference