1. Overview
Consequence modeling predicts the severity and extent of hazards from accidental releases. Results inform integrity management priorities, emergency response zones, and facility siting decisions.
Regulatory Framework
| Standard | Application | Key Requirements |
|---|---|---|
| 49 CFR 192.903 | Gas pipelines | PIR formula for HCA identification |
| API 521 | Pressure relief/flares | Thermal radiation from relief devices |
| API RP 752 | Building siting | 5 kW/m² safe distance criterion |
| API 581 | Risk-based inspection | Consequence categories for risk matrices |
| EPA RMP (40 CFR 68) | Toxic releases | ERPG endpoints, worst-case analysis |
Consequence Types
🔥 Jet Fire
High-pressure ignited release
Thermal radiation from momentum-dominated flame. Primary hazard for gas pipelines.
🔥 Pool Fire
Liquid spill ignition
Burning liquid pool. Relevant for condensate, crude, NGL releases.
💥 VCE
Vapor cloud explosion
Delayed ignition in congested area. Overpressure damage.
💥 BLEVE
Boiling liquid expanding vapor
Catastrophic vessel failure. Fireball + fragments.
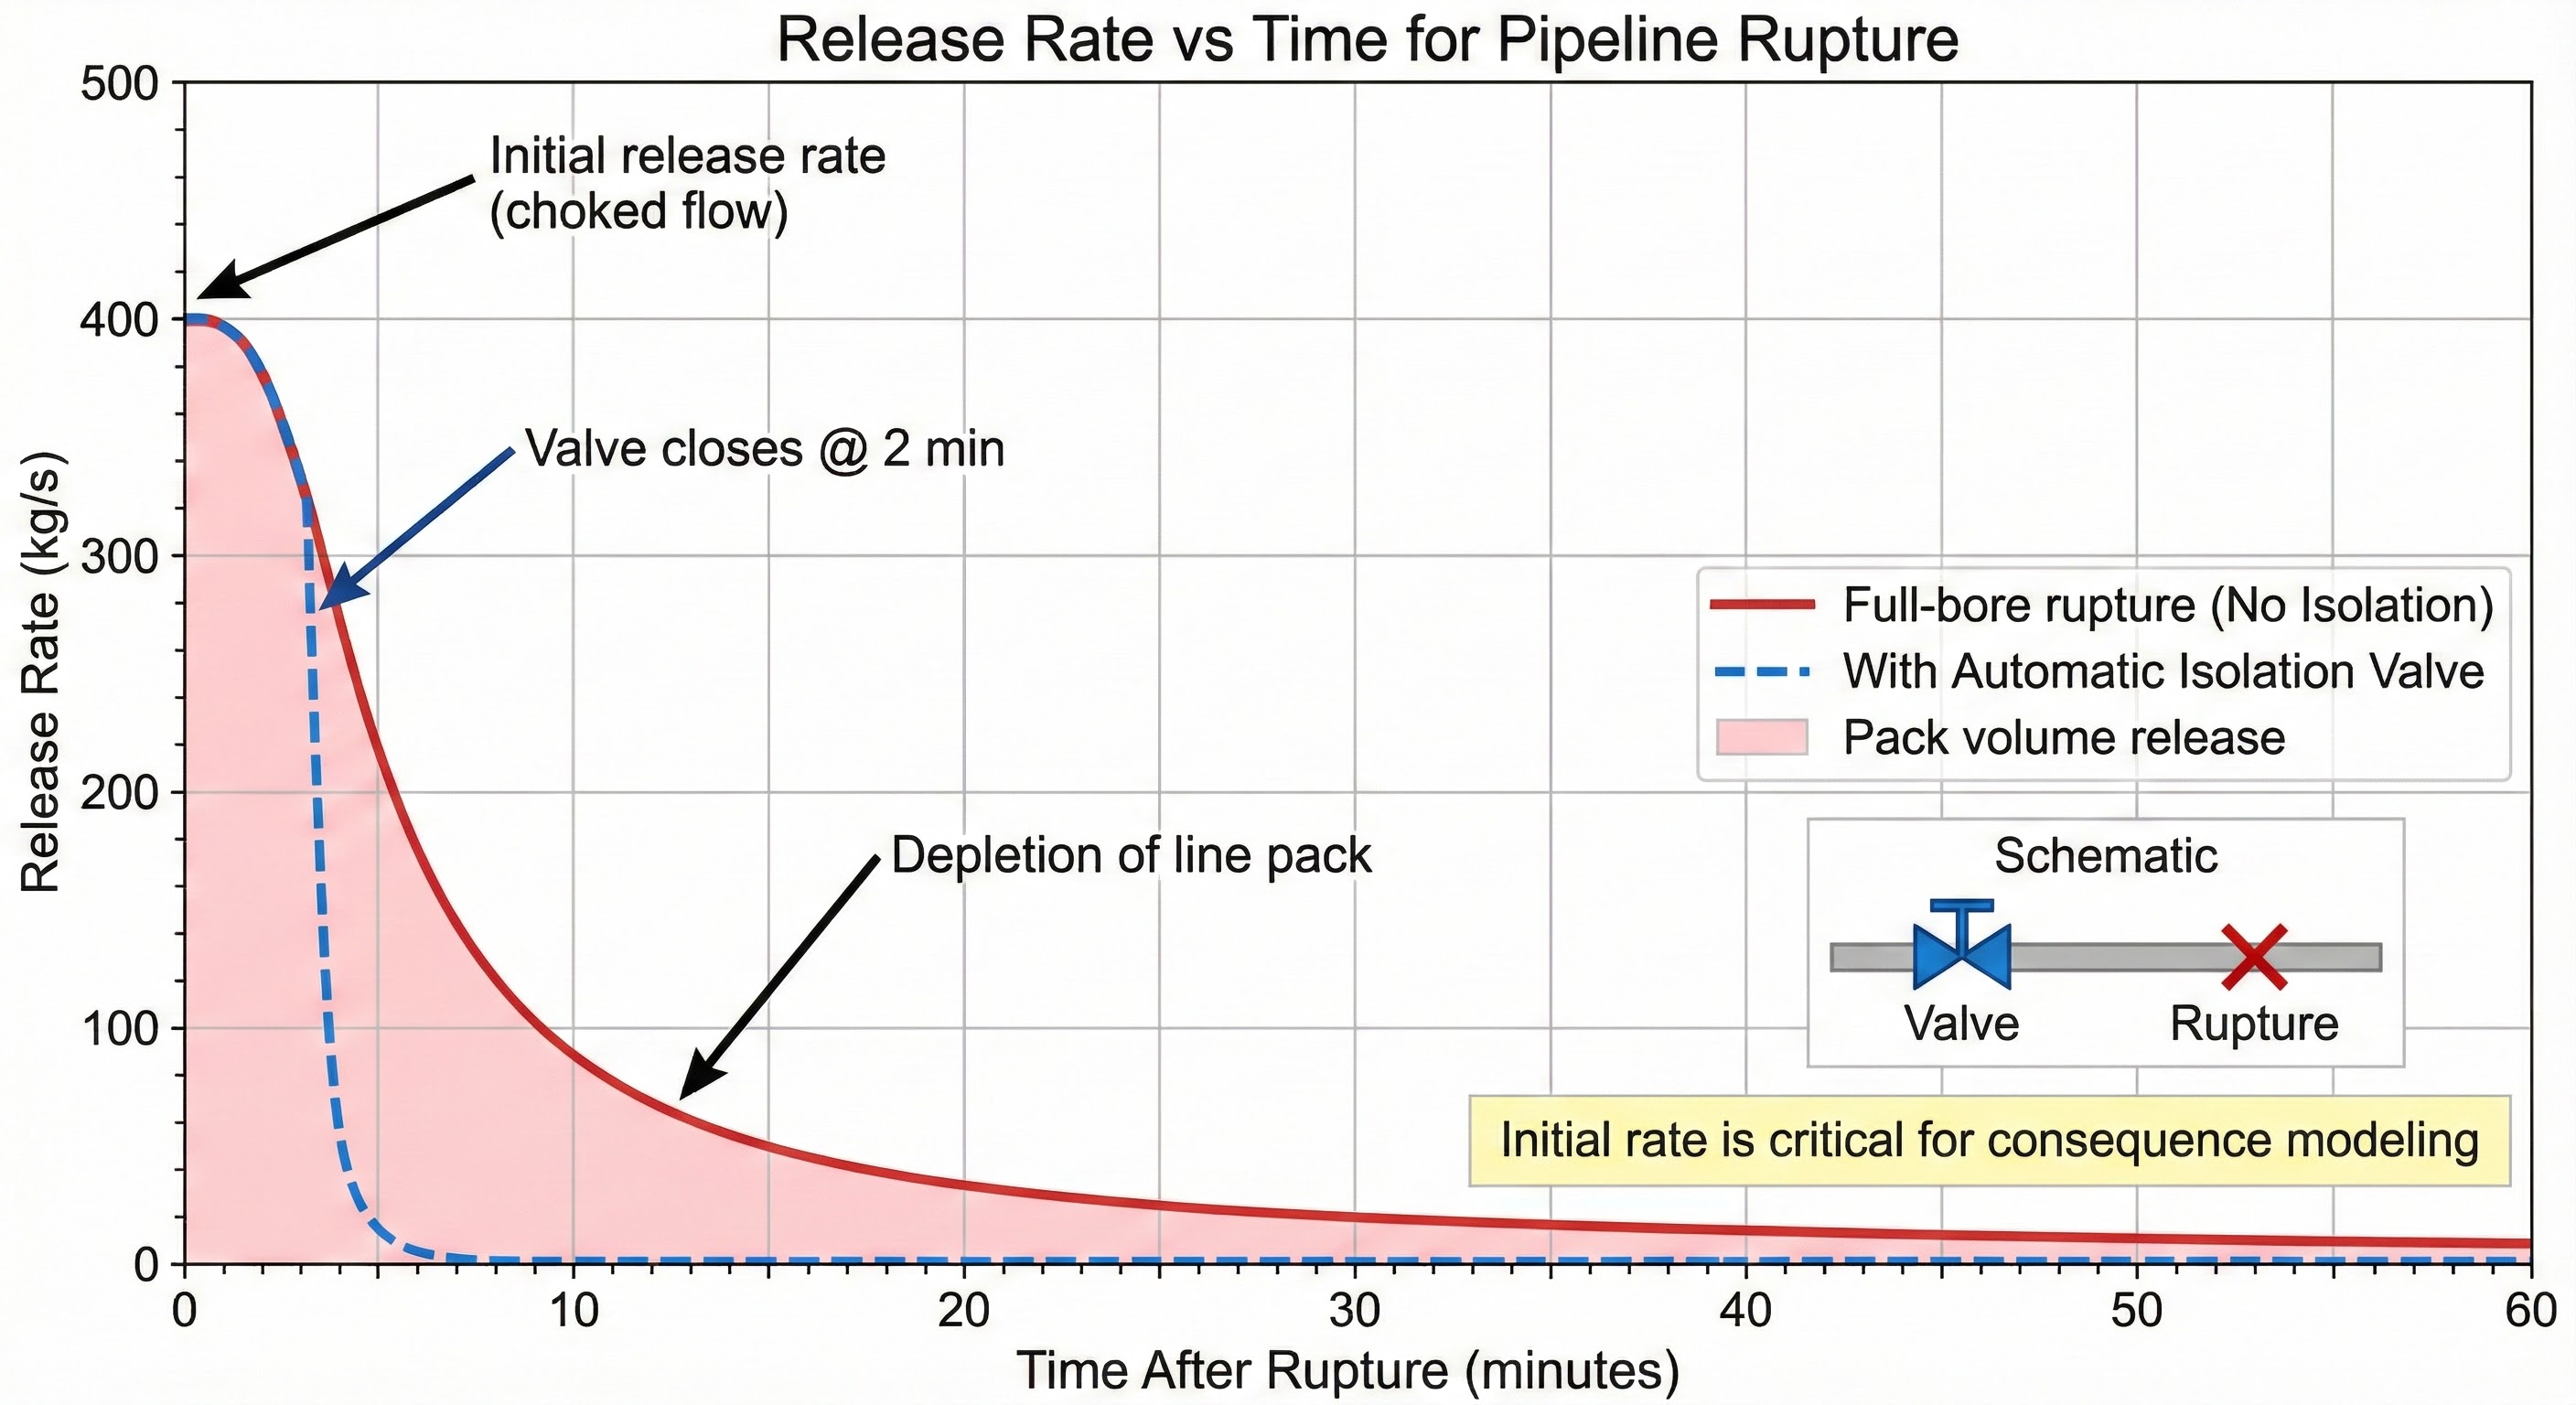
2. Release Rate Calculation
Accurate release rate is the foundation of consequence modeling. For high-pressure gas systems, flow is typically choked (sonic) at the release point.
Hole Size Scenarios
| Scenario | Hole Size | Typical Application |
|---|---|---|
| Small leak | ¼" diameter | Valve packing, fitting leak |
| Medium hole | 1" diameter | Instrument connection failure |
| Large hole | 4" diameter | Branch connection rupture |
| Full-bore rupture | Pipe diameter | Guillotine break (HCA analysis) |
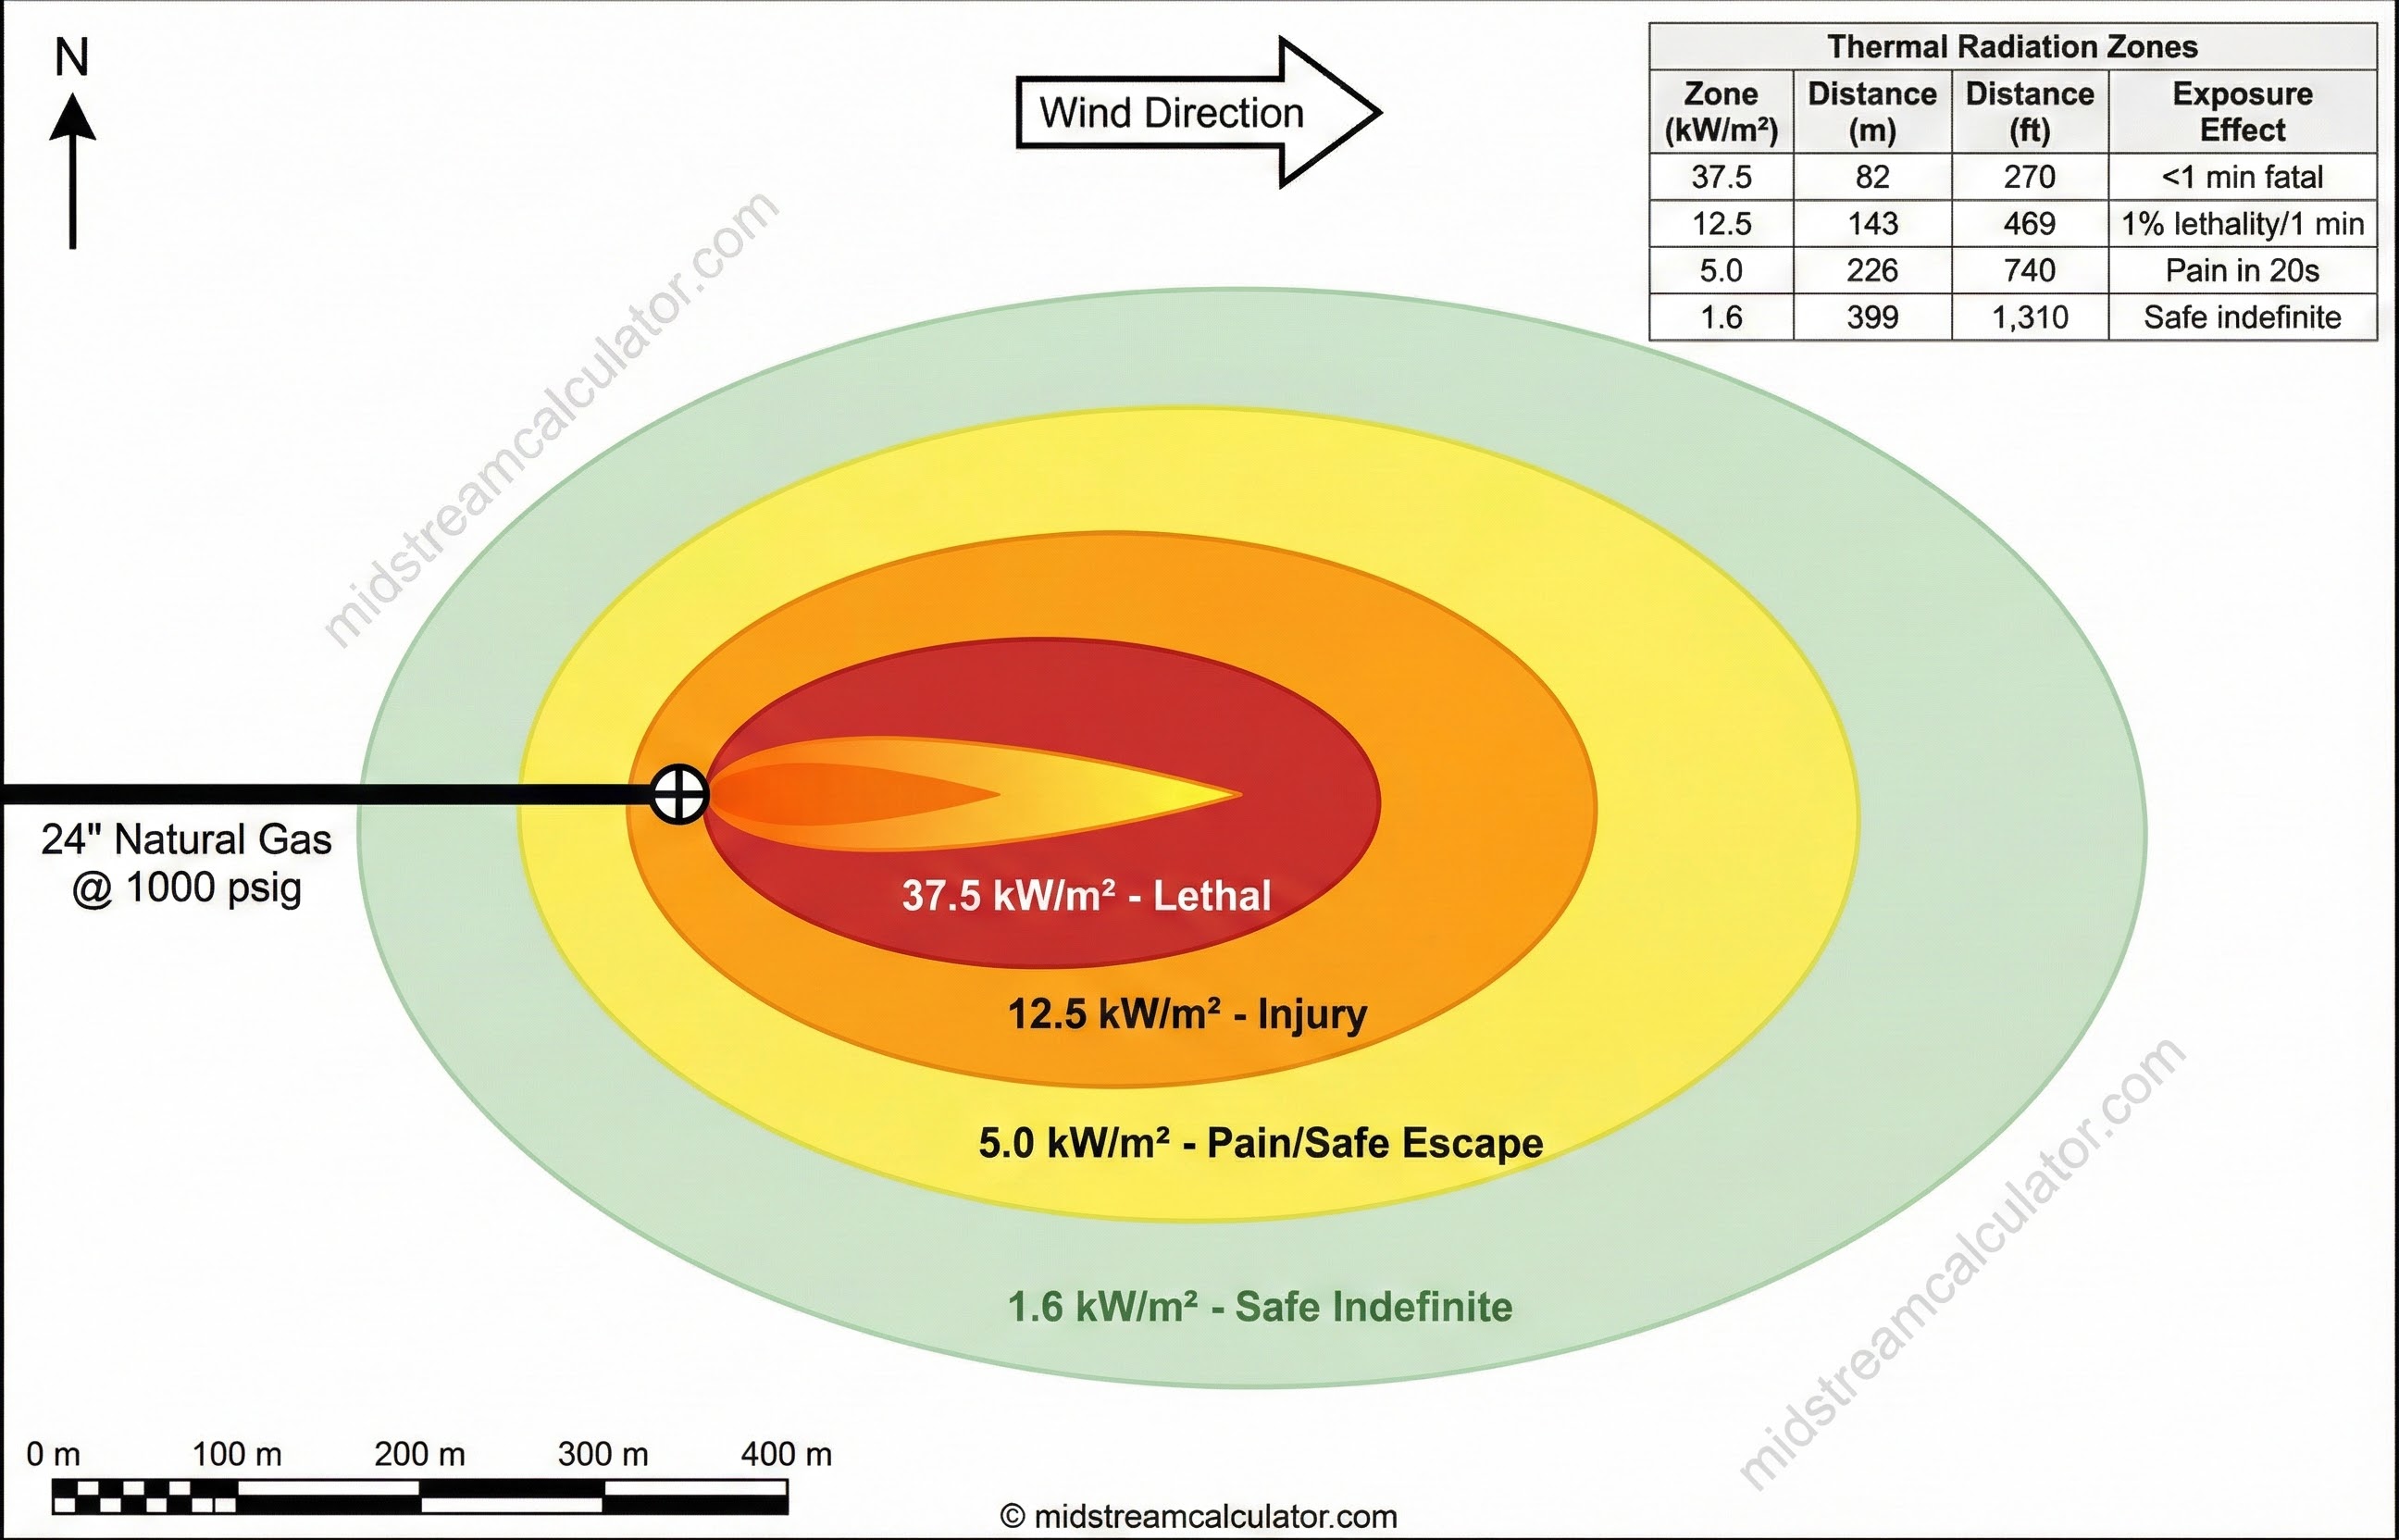
3. Jet Fire Modeling
A jet fire occurs when high-pressure gas release ignites immediately. The flame is momentum-dominated with high surface temperatures (1200-1500°C) and significant thermal radiation.
Thermal Radiation
Thermal Radiation Criteria
| Heat Flux (kW/m²) | Human Effects | Equipment Effects | Use Case |
|---|---|---|---|
| 1.6 | No harm, indefinite | None | Public areas |
| 5.0 | Pain in 20s, 1st degree burn | Minor | Safe escape distance (API 752) |
| 12.5 | 1% lethality in 1 min | Cable damage | Emergency response zone |
| 25 | Significant injury | Steel weakening | Equipment spacing |
| 37.5 | 100% lethality in <1 min | Structural failure | Exclusion zone |
4. Pool Fire Modeling
Pool fires result from ignited liquid spills. Pool size depends on spill rate, containment, and burning rate. Smoke obscuration reduces effective radiation for large pools.
Burning Rates by Fuel
| Fuel | Burning Rate (kg/m²·s) | LHV (MJ/kg) | SEP* (kW/m²) |
|---|---|---|---|
| LNG | 0.078 | 50 | 180-220 |
| LPG (propane) | 0.099 | 46 | 80-150 |
| Gasoline | 0.055 | 44 | 60-130 |
| Crude oil | 0.045 | 43 | 40-80 |
| Condensate | 0.050 | 45 | 60-100 |
*SEP = Surface Emissive Power. Decreases with pool size due to smoke obscuration.
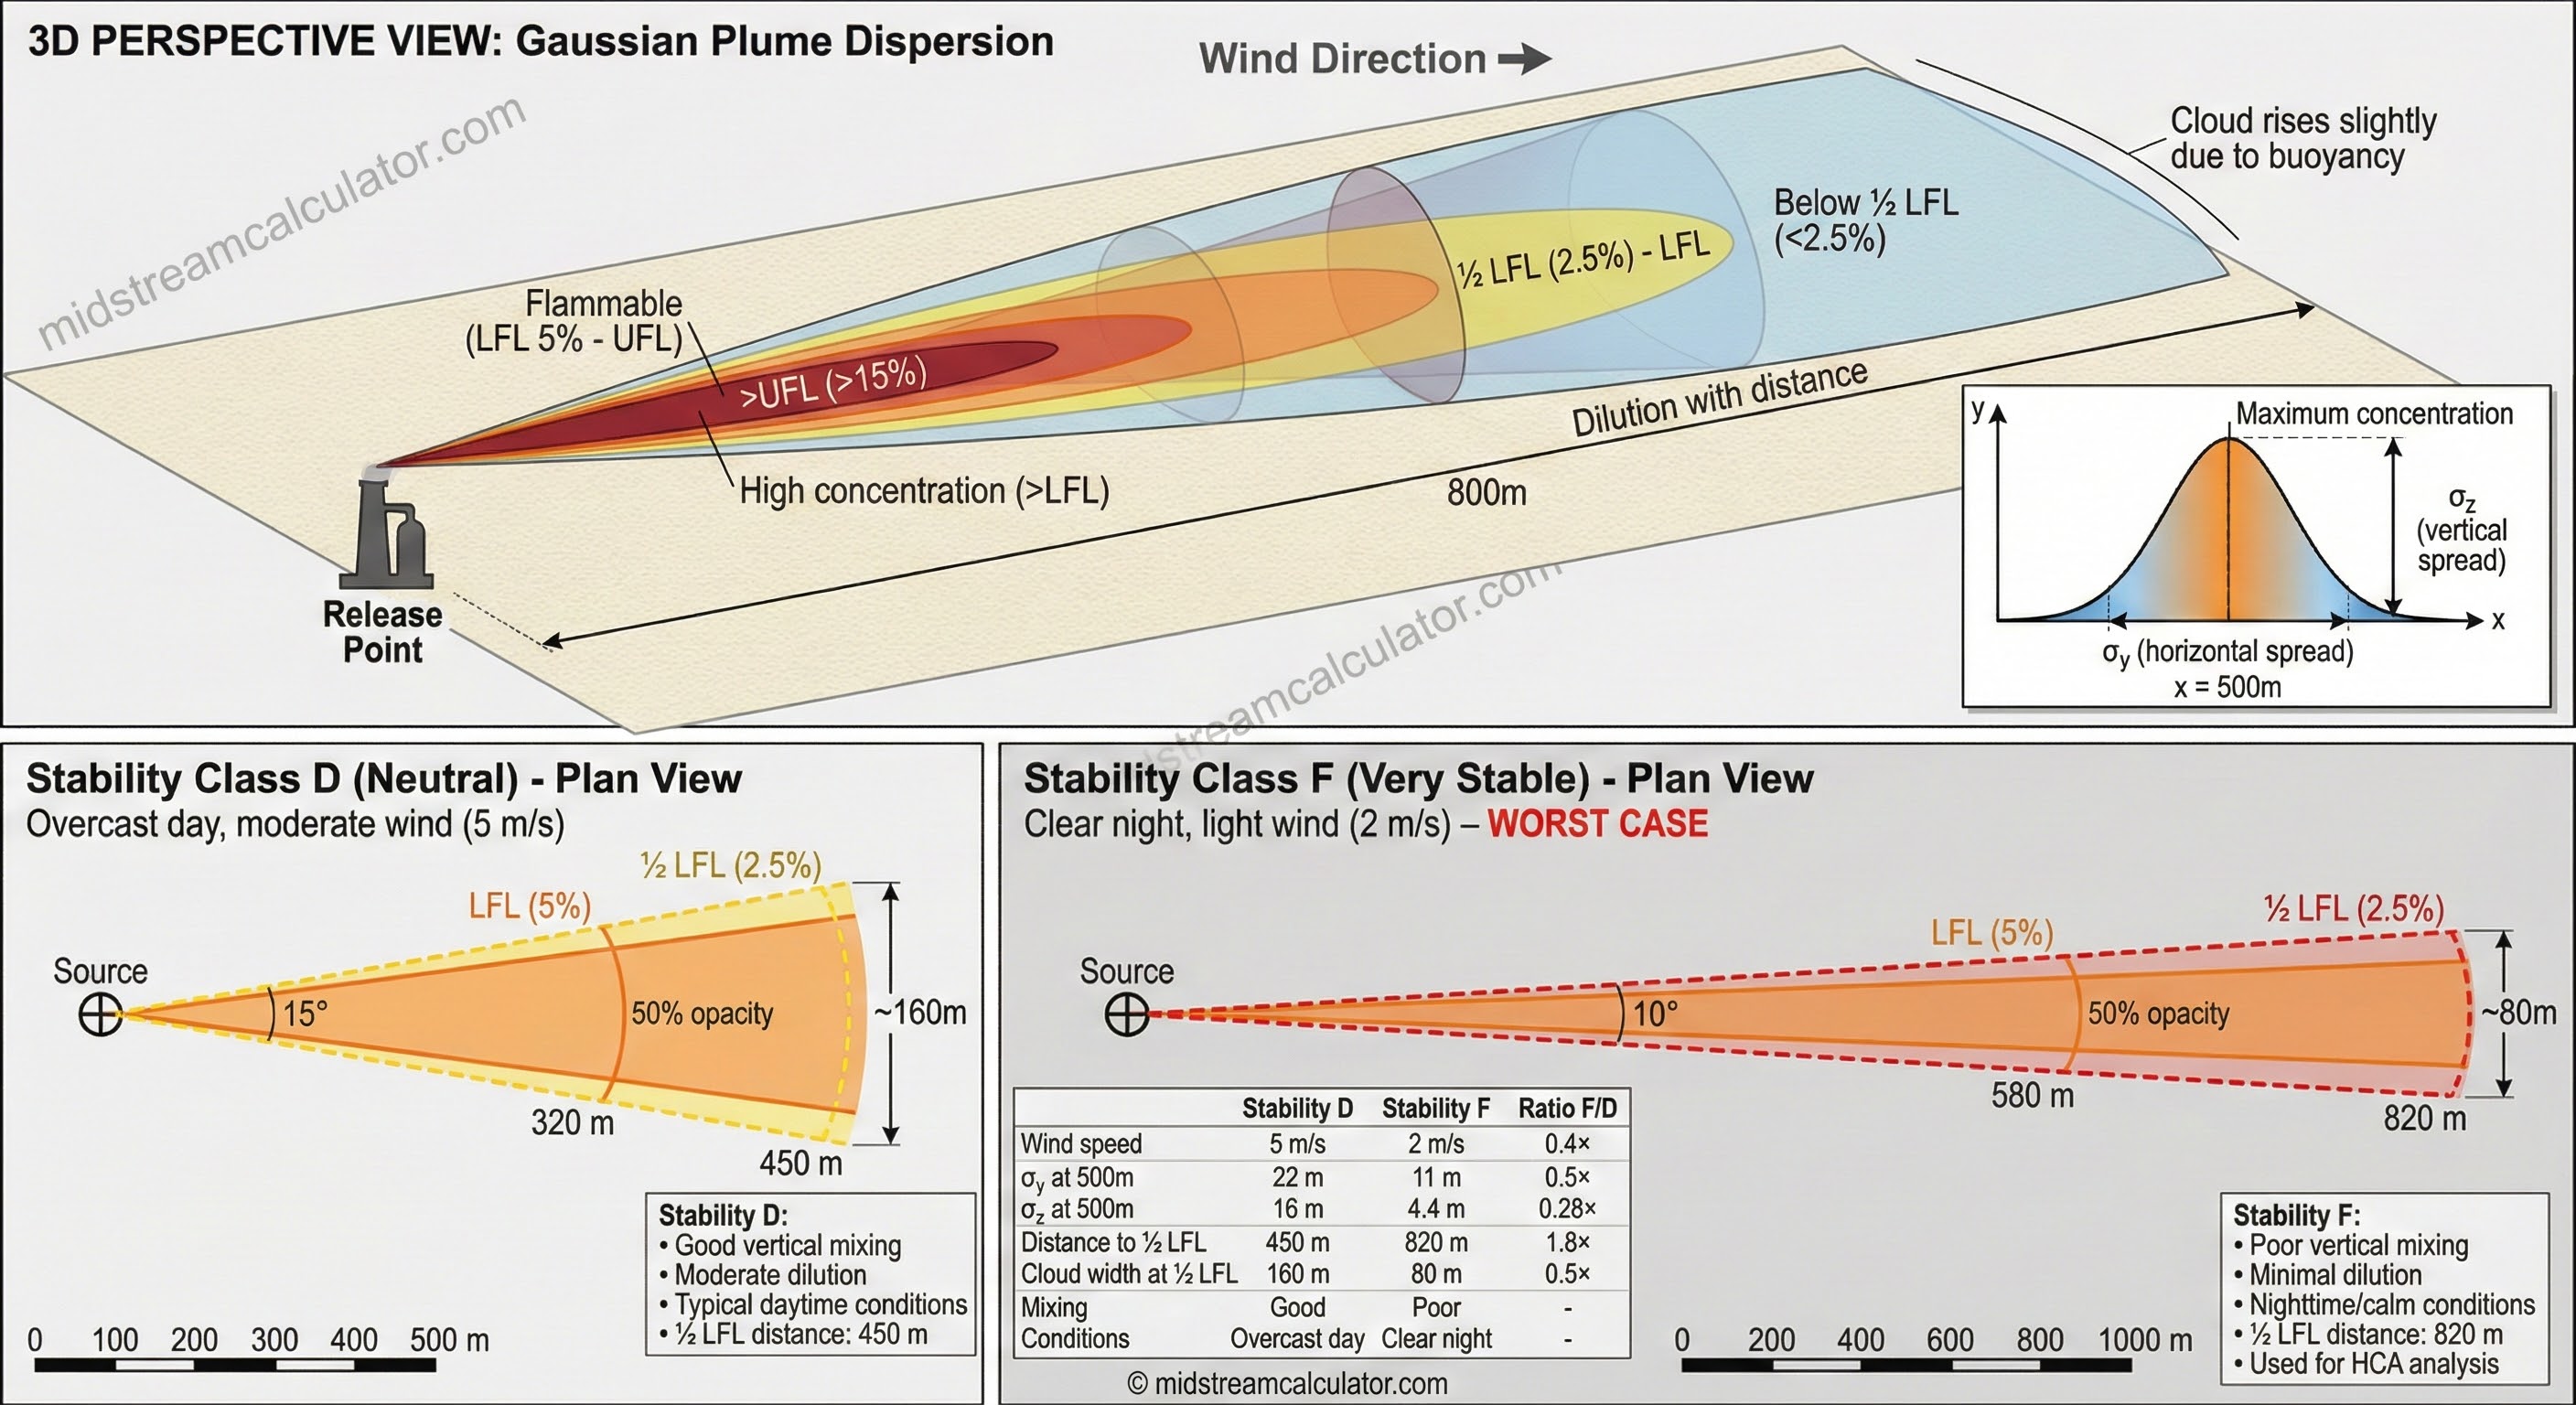
5. Gas Dispersion Modeling
Dispersion models predict the extent of flammable or toxic gas clouds. The Gaussian plume model is standard for neutrally buoyant gases in open terrain.
Atmospheric Stability Classes
| Class | Stability | Conditions | Consequence |
|---|---|---|---|
| A | Very unstable | Strong sun, light wind | Rapid dilution, shortest distance |
| B-C | Unstable | Moderate sun | Good mixing |
| D | Neutral | Overcast, any wind | Most common condition |
| E-F | Stable | Clear night, light wind | Poor mixing, longest distance |
Flammability Limits
| Gas | LFL (%) | UFL (%) | Notes |
|---|---|---|---|
| Methane (natural gas) | 5.0 | 15.0 | Use ½ LFL = 2.5% for hazard zone |
| Propane | 2.1 | 9.5 | Dense gas - use DEGADIS |
| Hydrogen | 4.0 | 75.0 | Very wide range |
| Hydrogen sulfide | 4.0 | 44.0 | Also toxic (see ERPG) |
6. Vapor Cloud Explosion
A Vapor Cloud Explosion (VCE) occurs when a flammable gas cloud ignites in a congested or confined area. Turbulence from obstacles accelerates the flame front, generating overpressure.
Overpressure Damage Criteria
| Overpressure (psi) | (kPa) | Structural Effects | Human Effects |
|---|---|---|---|
| 0.3 | 2 | Glass breakage | None |
| 1.0 | 7 | Window frames fail, minor roof damage | Injuries from glass |
| 2.0 | 14 | Unreinforced walls collapse | Injuries, some fatalities |
| 3.0 | 21 | Steel frame damage | Serious injuries |
| 5.0 | 35 | Most buildings collapse | ~50% lethality |
| 7.0 | 48 | Reinforced concrete damage | Near 100% lethality |
VCE vs Flash Fire
Not all vapor cloud ignitions produce significant overpressure:
- Flash fire: Unconfined, uncongested area → thermal hazard only within LFL boundary, negligible overpressure (<0.1 psi)
- VCE: Congested area (pipe racks, equipment) or partial confinement → flame acceleration → significant overpressure (0.5-10+ psi)
7. BLEVE (Boiling Liquid Expanding Vapor Explosion)
A BLEVE occurs when a vessel containing pressurized liquid above its atmospheric boiling point fails catastrophically. The rapid vaporization creates a fireball with three hazard zones: thermal radiation, overpressure, and projectile fragments.
BLEVE Hazard Comparison
| Hazard | Typical Range | Dominates When |
|---|---|---|
| Thermal (fireball) | 3-10× fireball diameter | Large liquid inventory |
| Overpressure (burst) | 50-200 m | High vessel pressure |
| Fragments | 300-1000+ m | Often the farthest hazard |
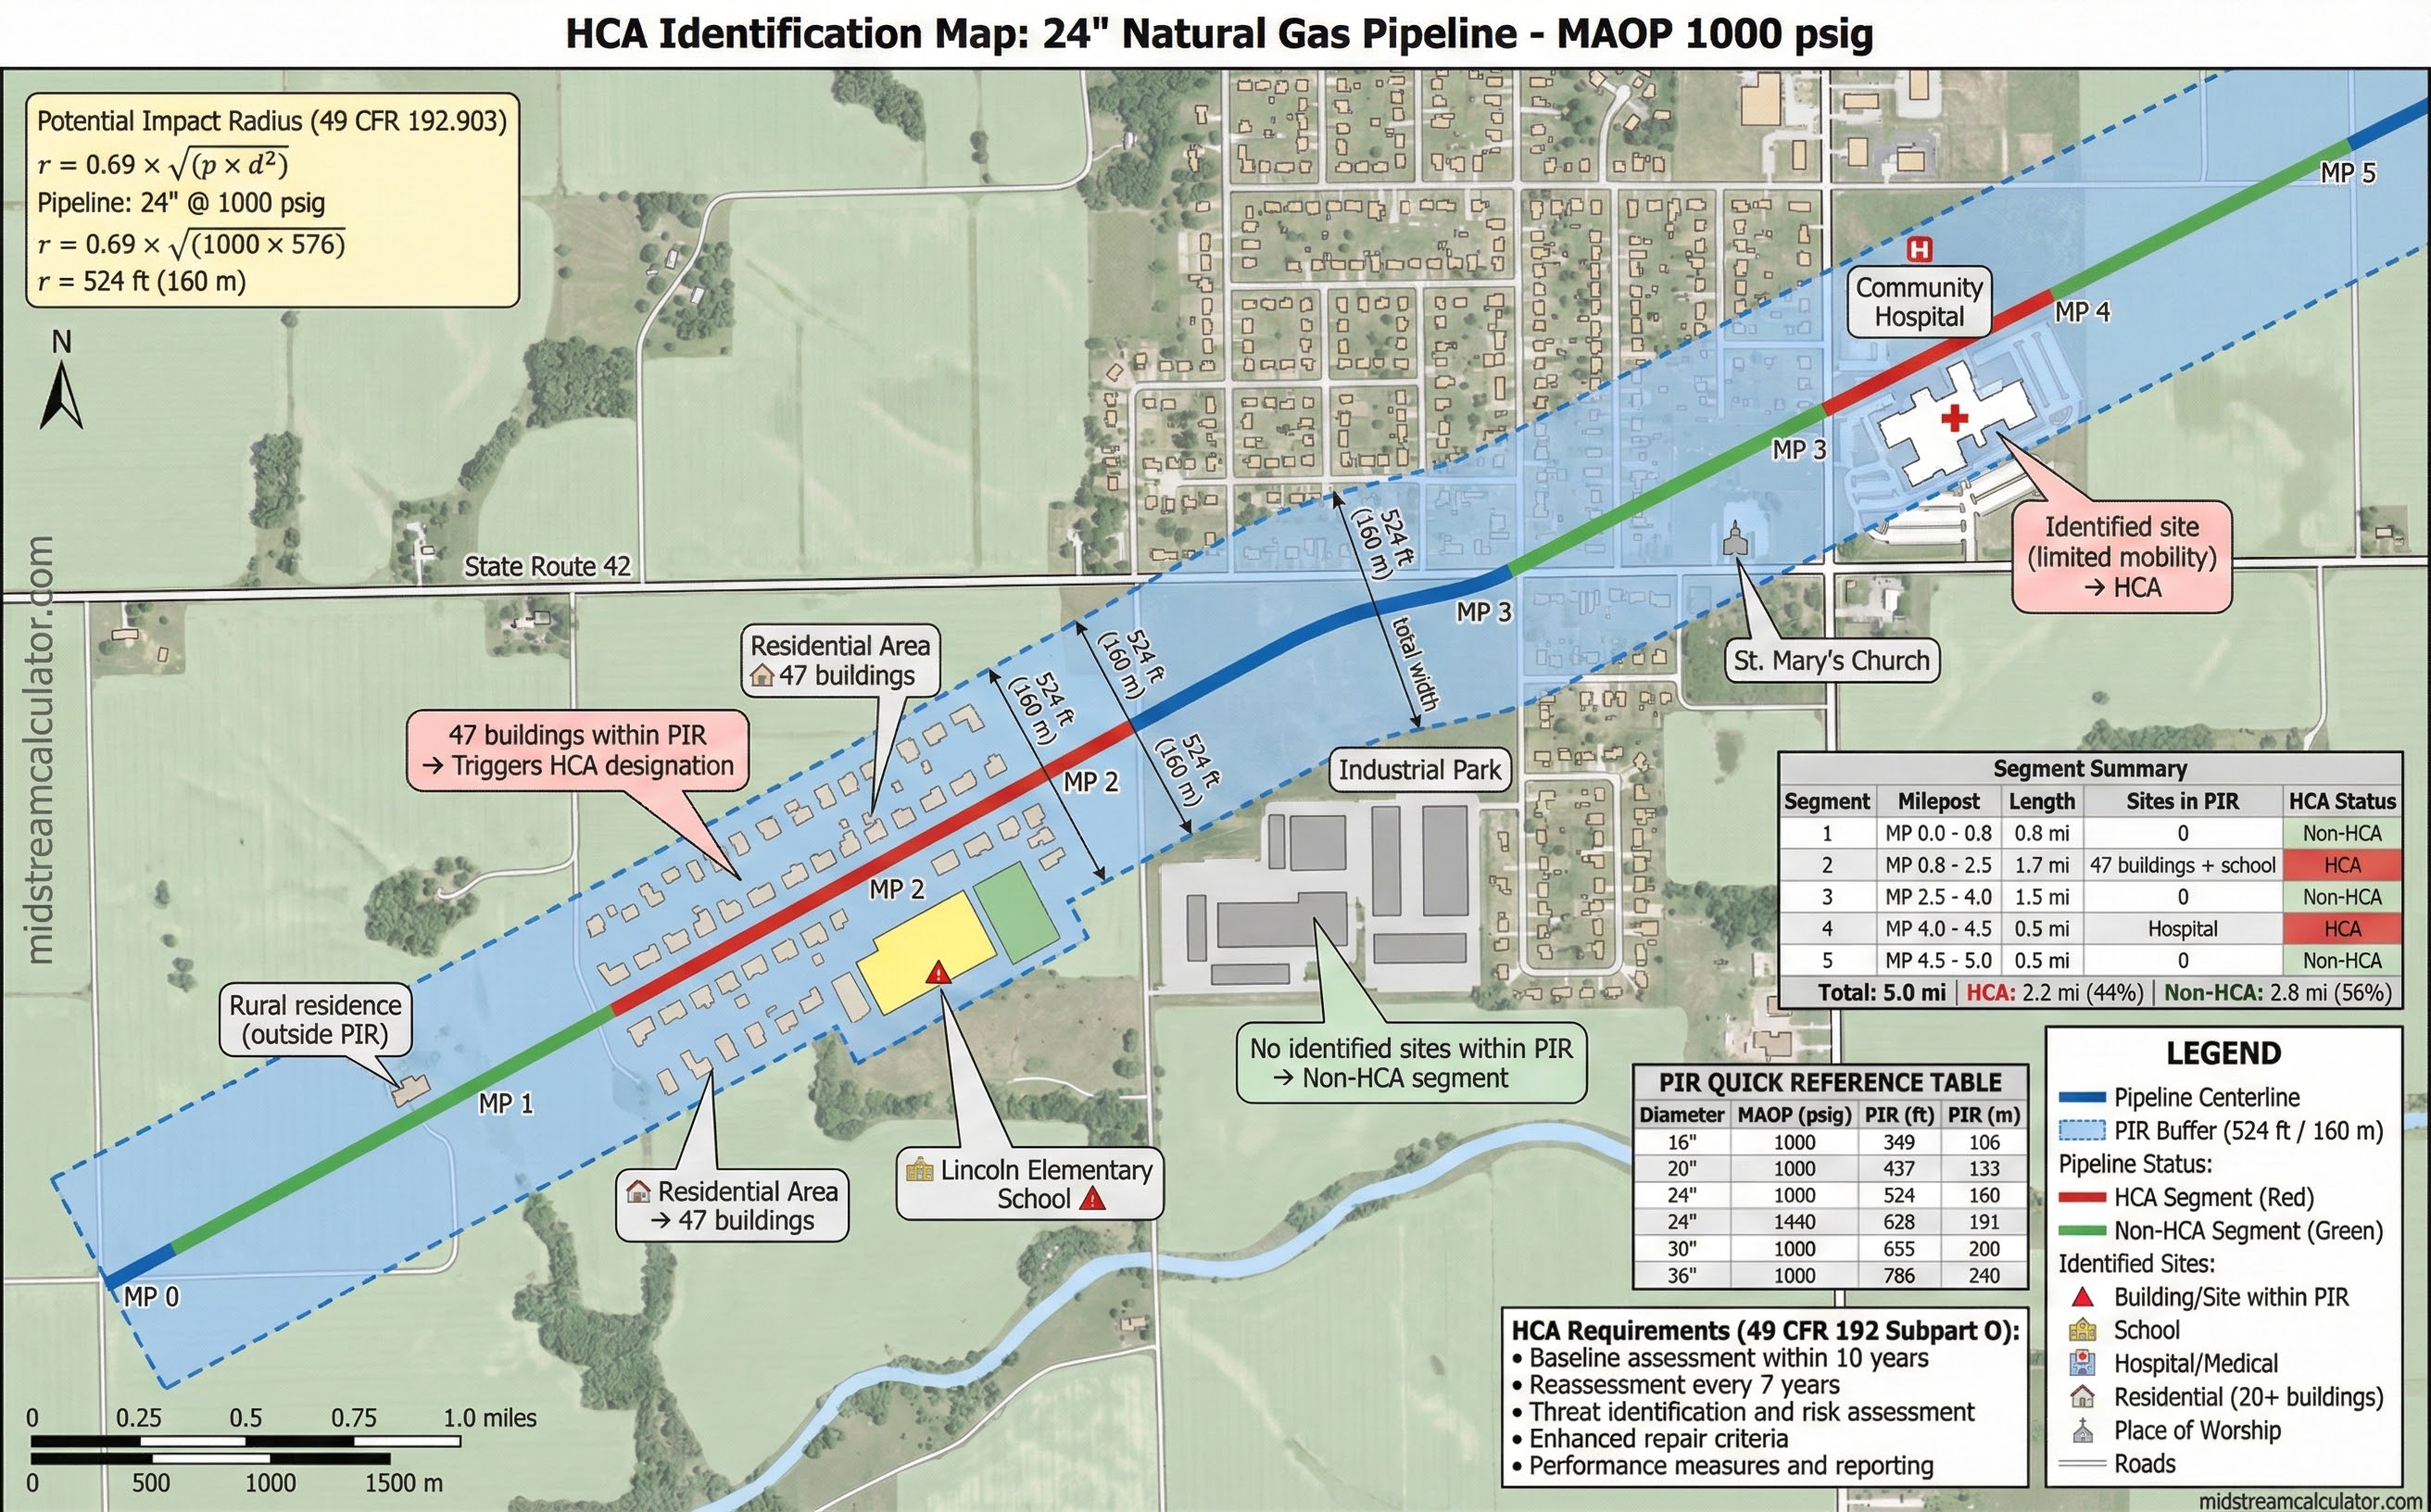
8. HCA Determination (49 CFR 192)
Federal regulations require gas pipeline operators to identify High Consequence Areas (HCAs) using the Potential Impact Radius (PIR) formula or consequence modeling.
PIR Quick Reference
| Diameter | PIR (feet) by MAOP | |||
|---|---|---|---|---|
| (inches) | 500 psig | 1000 psig | 1440 psig | 2000 psig |
| 12 | 186 | 263 | 314 | 370 |
| 20 | 309 | 437 | 524 | 617 |
| 24 | 371 | 524 | 628 | 740 |
| 30 | 463 | 655 | 785 | 925 |
| 36 | 556 | 786 | 942 | 1,110 |
| 42 | 649 | 917 | 1,099 | 1,295 |
Alternative: Consequence-Based PIR
Operators may use consequence modeling instead of the prescriptive formula:
- Calculate thermal radiation distance to 5 kW/m² for worst-case rupture
- Use dispersion modeling to find ½ LFL distance (F2 weather)
- Use the larger of formula PIR or consequence model result
Software & Best Practices
Common Modeling Software
| Software | Vendor | Strengths |
|---|---|---|
| PHAST | DNV | Comprehensive dispersion, fire, explosion |
| ALOHA | EPA/NOAA | Free, RMP compliance, emergency response |
| CANARY | Quest | Pipeline-specific, ignition probability |
| EFFECTS | TNO | Multi-energy VCE, LNG |
| SAFER Trace | SAFER Systems | GIS integration, real-time |
Quality Assurance Checklist
- Release rate: Verify choked flow calculation, correct units
- Weather: F2 stability for worst-case, D5 for typical
- Gas properties: MW, LFL, LHV match composition (not default methane)
- Order of magnitude: Sanity check results against rules of thumb
- Model applicability: Gaussian valid for light gases in open terrain
- Documentation: Record all assumptions, software version, limitations
Ready to use the calculator?
→ Launch Calculator