1. Blowdown Principles
Blowdown (depressuring) systems rapidly reduce pressure in process equipment during emergencies—typically fire exposure. The goal: reduce wall stress before fire weakens the metal to failure.
Driver
Fire case
Relieve stress before steel loses strength from heat.
Target
100 psig / 50% MAWP
Depressure to the lower value within the specified time.
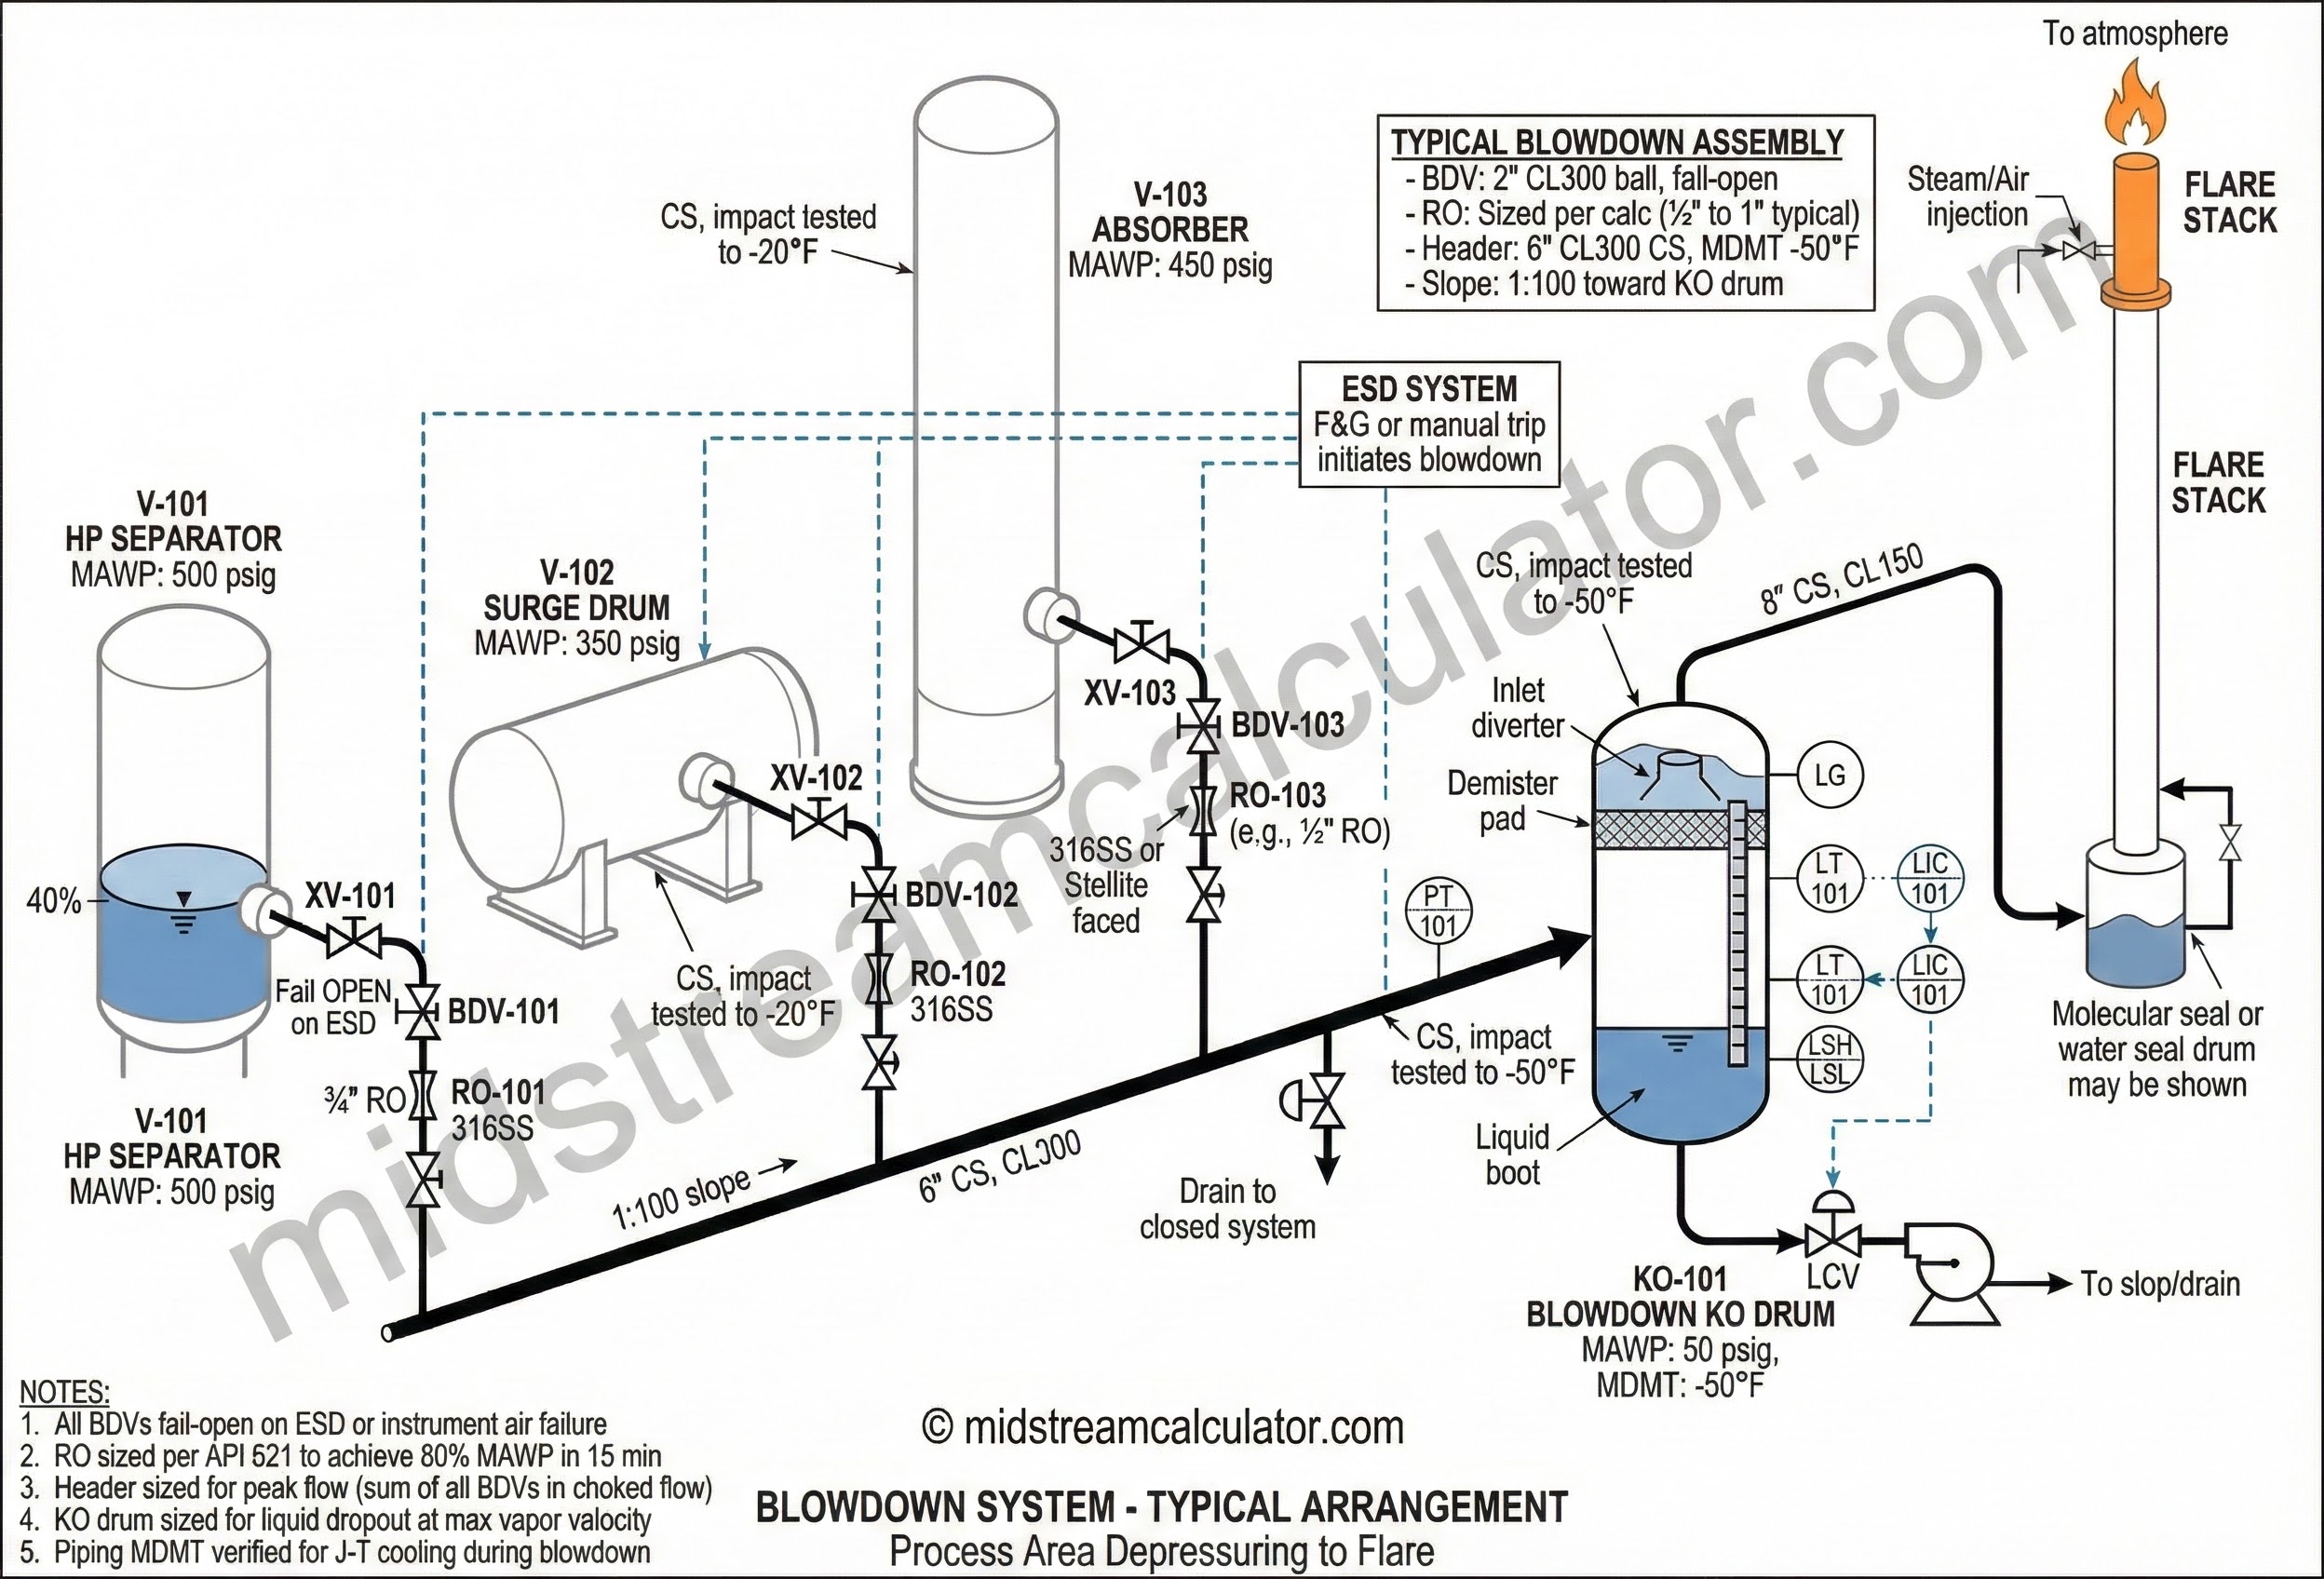
Flow path
BDV → RO → KO → Flare
Valve, restriction, knockout, then to flare/header.
Control
ESD triggered
Automatic fail action on emergency shutdown signal.
Why Blowdown?
- Fire case: Reduce stress before vessel wall loses strength
- Hydrocarbon release: Minimize inventory available for fire/explosion
- Maintenance: Depressure for safe entry or repair
- Process upset: Prevent overpressure during runaway
API 521 Criteria
For fire exposure, depressure to:
- Target pressure: 100 psig or 50% of design pressure (whichever is lower)
- Target time: 15 minutes (typical), may vary by risk assessment
2. Orifice Sizing
Blowdown orifice must allow adequate flow to meet depressuring time target. Size using critical flow assumption for most of blowdown duration.
Simplified Sizing Equation
Example Calculation
Given: V = 1000 ft³, P1 = 500 psia, P2 = 115 psia, t = 15 min, MW = 20, T = 100°F
⚠ Verify with dynamic simulation: Simplified equations assume constant T and single phase. For accurate results (especially with liquid inventory or J-T cooling), use dynamic process simulation.
Pipeline Blowdown (Walworth Equation)
For pipeline segments, the Modified Walworth equation is commonly used:
The vessel equations above are for concentrated volumes; the Walworth equation accounts for distributed inventory in pipelines.
Define targets. Set P1, P2 (100 psig or 50% MAWP), and depressuring time (e.g., 15 min).
Size RO. Calculate orifice area using gas properties and volume; check choked vs subcritical.
Verify dynamically. Simulate blowdown to capture cooling, two-phase flow, and flare backpressure.
3. Depressurization Dynamics
Pressure-Time Profile
Blowdown through a fixed orifice follows an exponential decay pattern:
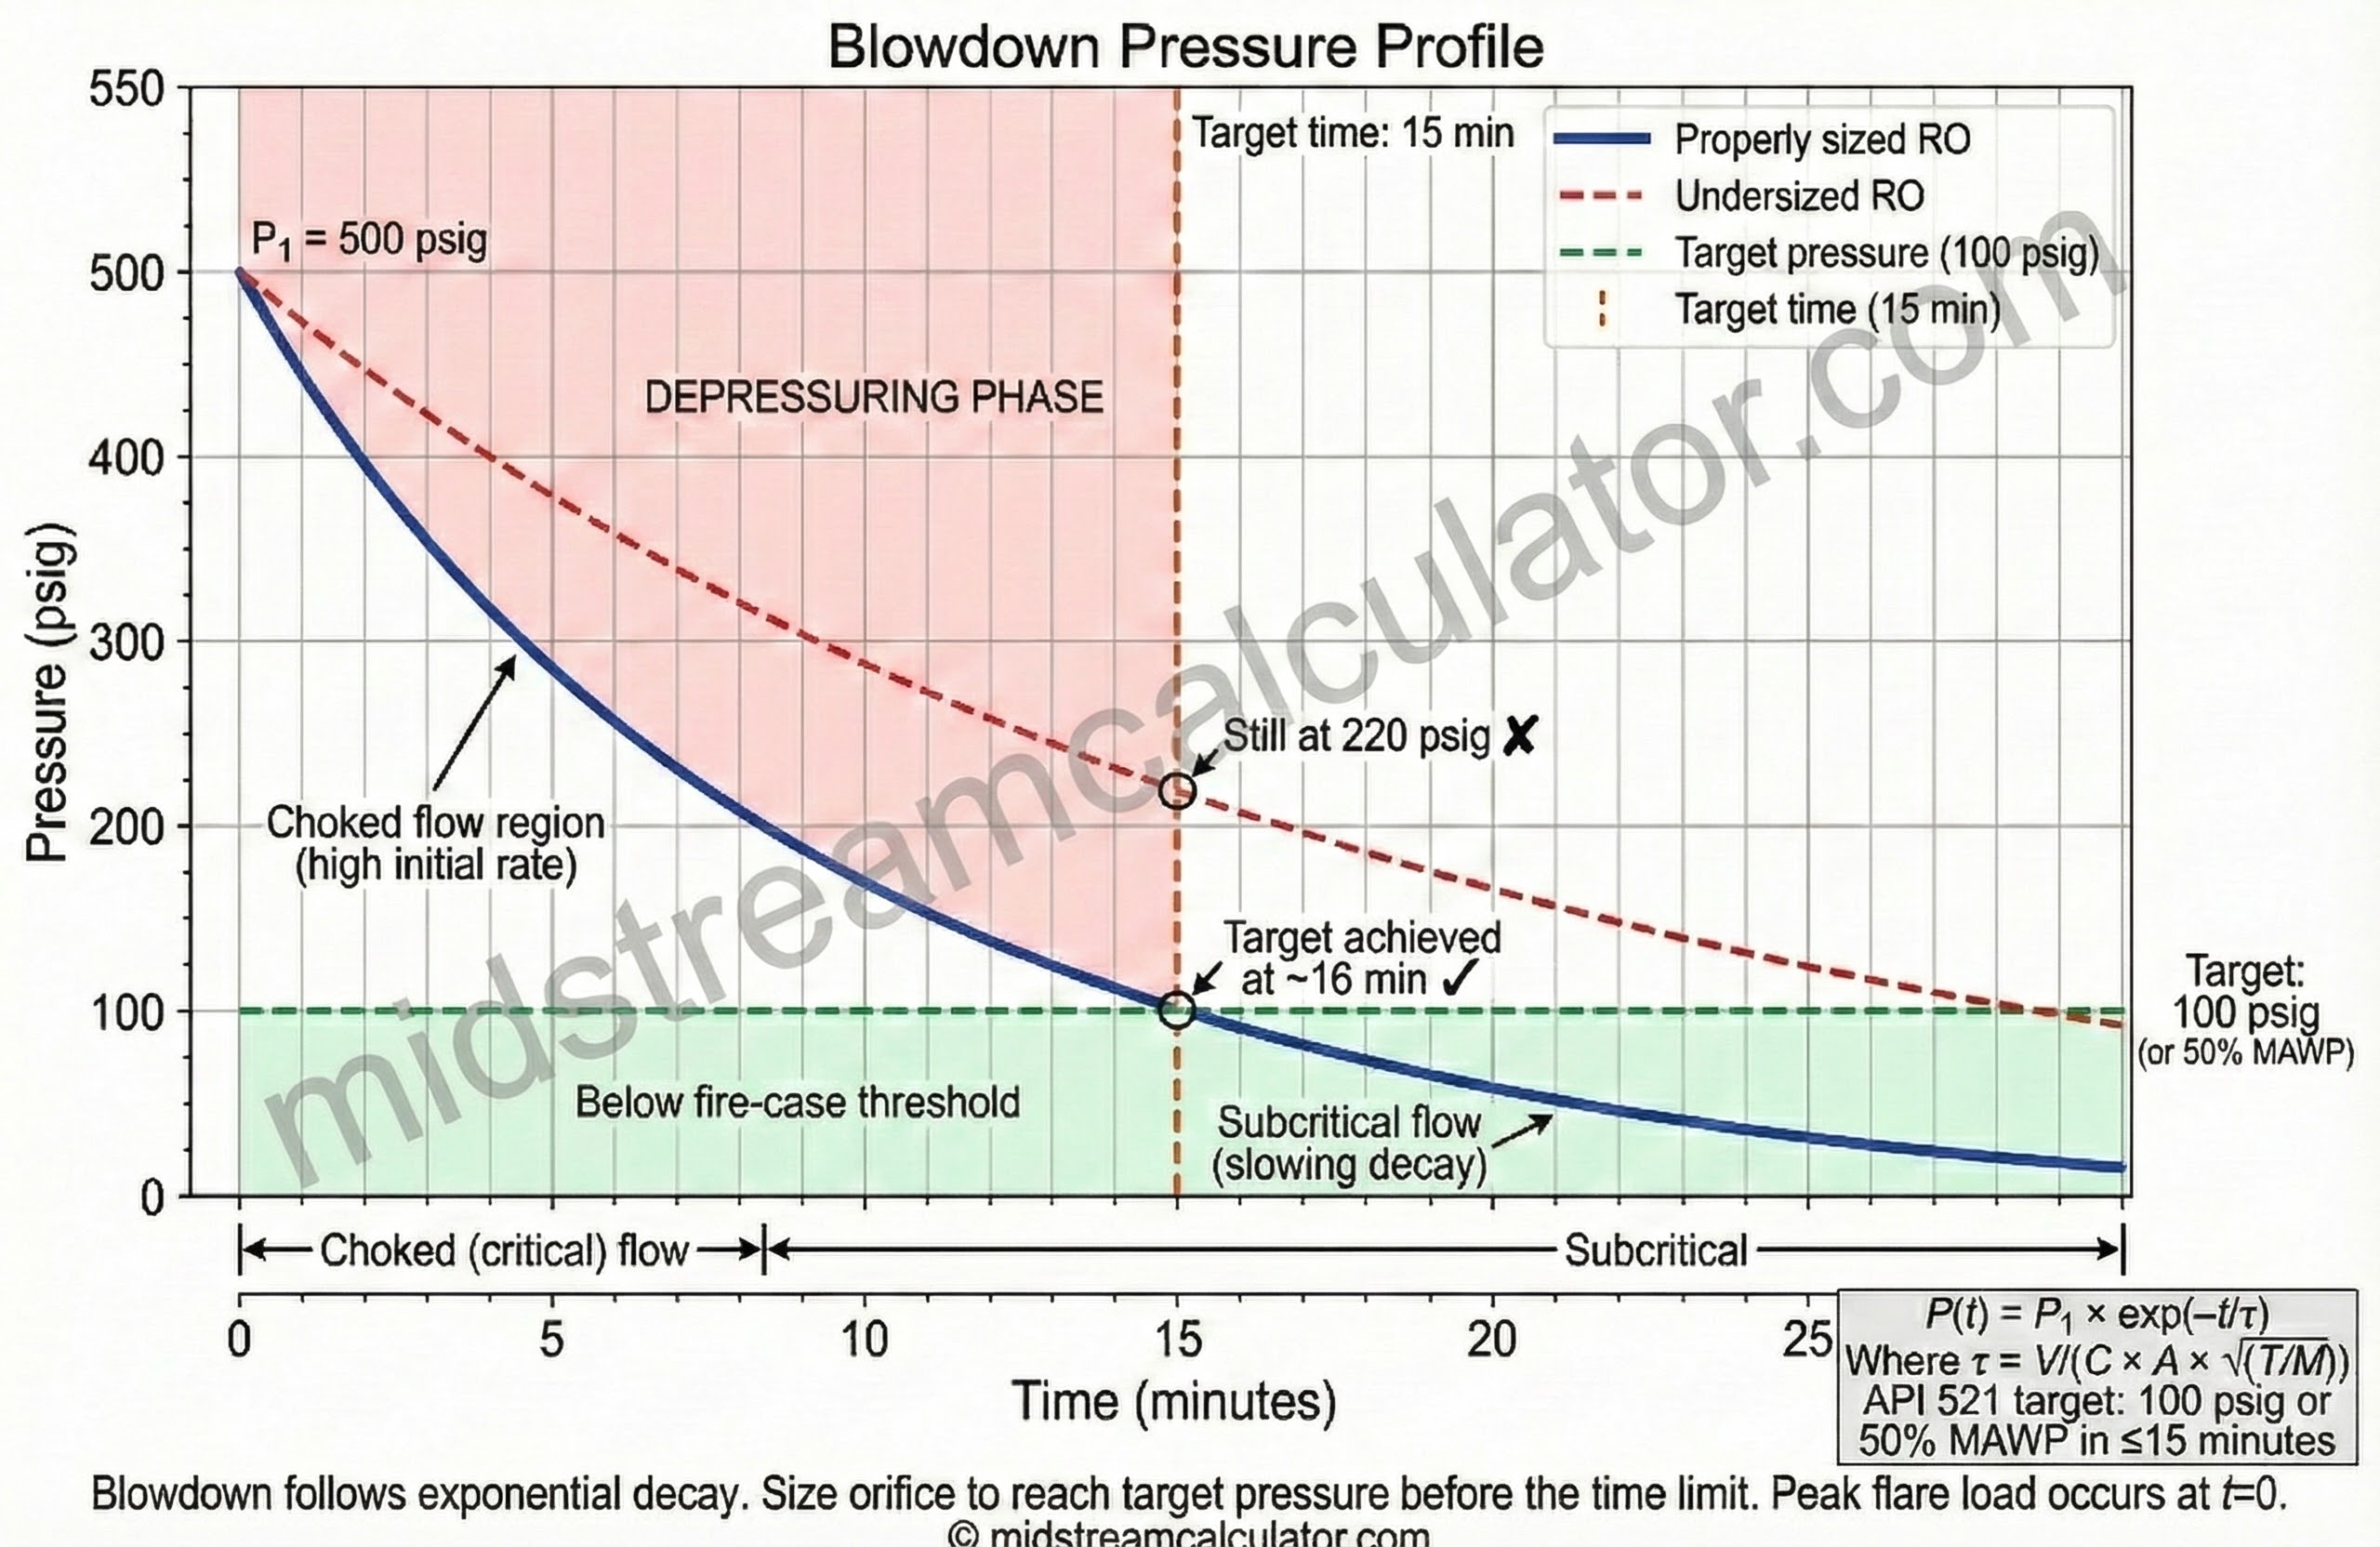
Flow regime
Choked → subcritical
Expect critical flow early; tail is subcritical as P drops.
Flare load
Peak at t = 0
Design flare for initial choked mass flow; decay thereafter.
τ sensitivity
Volume / area
Time constant scales with inventory and restriction area.
Critical Pressure Ratio
Flow becomes choked (sonic) when downstream pressure falls below the critical ratio:
When P_downstream/P_upstream < 0.546, flow is choked and mass rate depends only on upstream conditions.
Flow Rate During Blowdown
| Phase | Flow Regime | Flow Rate Behavior |
|---|---|---|
| Initial (0–80%) | Critical (choked) | Flow ∝ upstream pressure |
| Final (80–100%) | Subcritical | Flow ∝ √(P1 - P2) |
Initial Peak Flow Rate
4. Low-Temperature Considerations
Rapid depressuring causes significant cooling due to Joule-Thomson effect and gas expansion work. This can cause:
- Brittle fracture: If temperature drops below MDMT
- Hydrate formation: In wet gas systems
- Ice formation: From trace water
Temperature During Blowdown
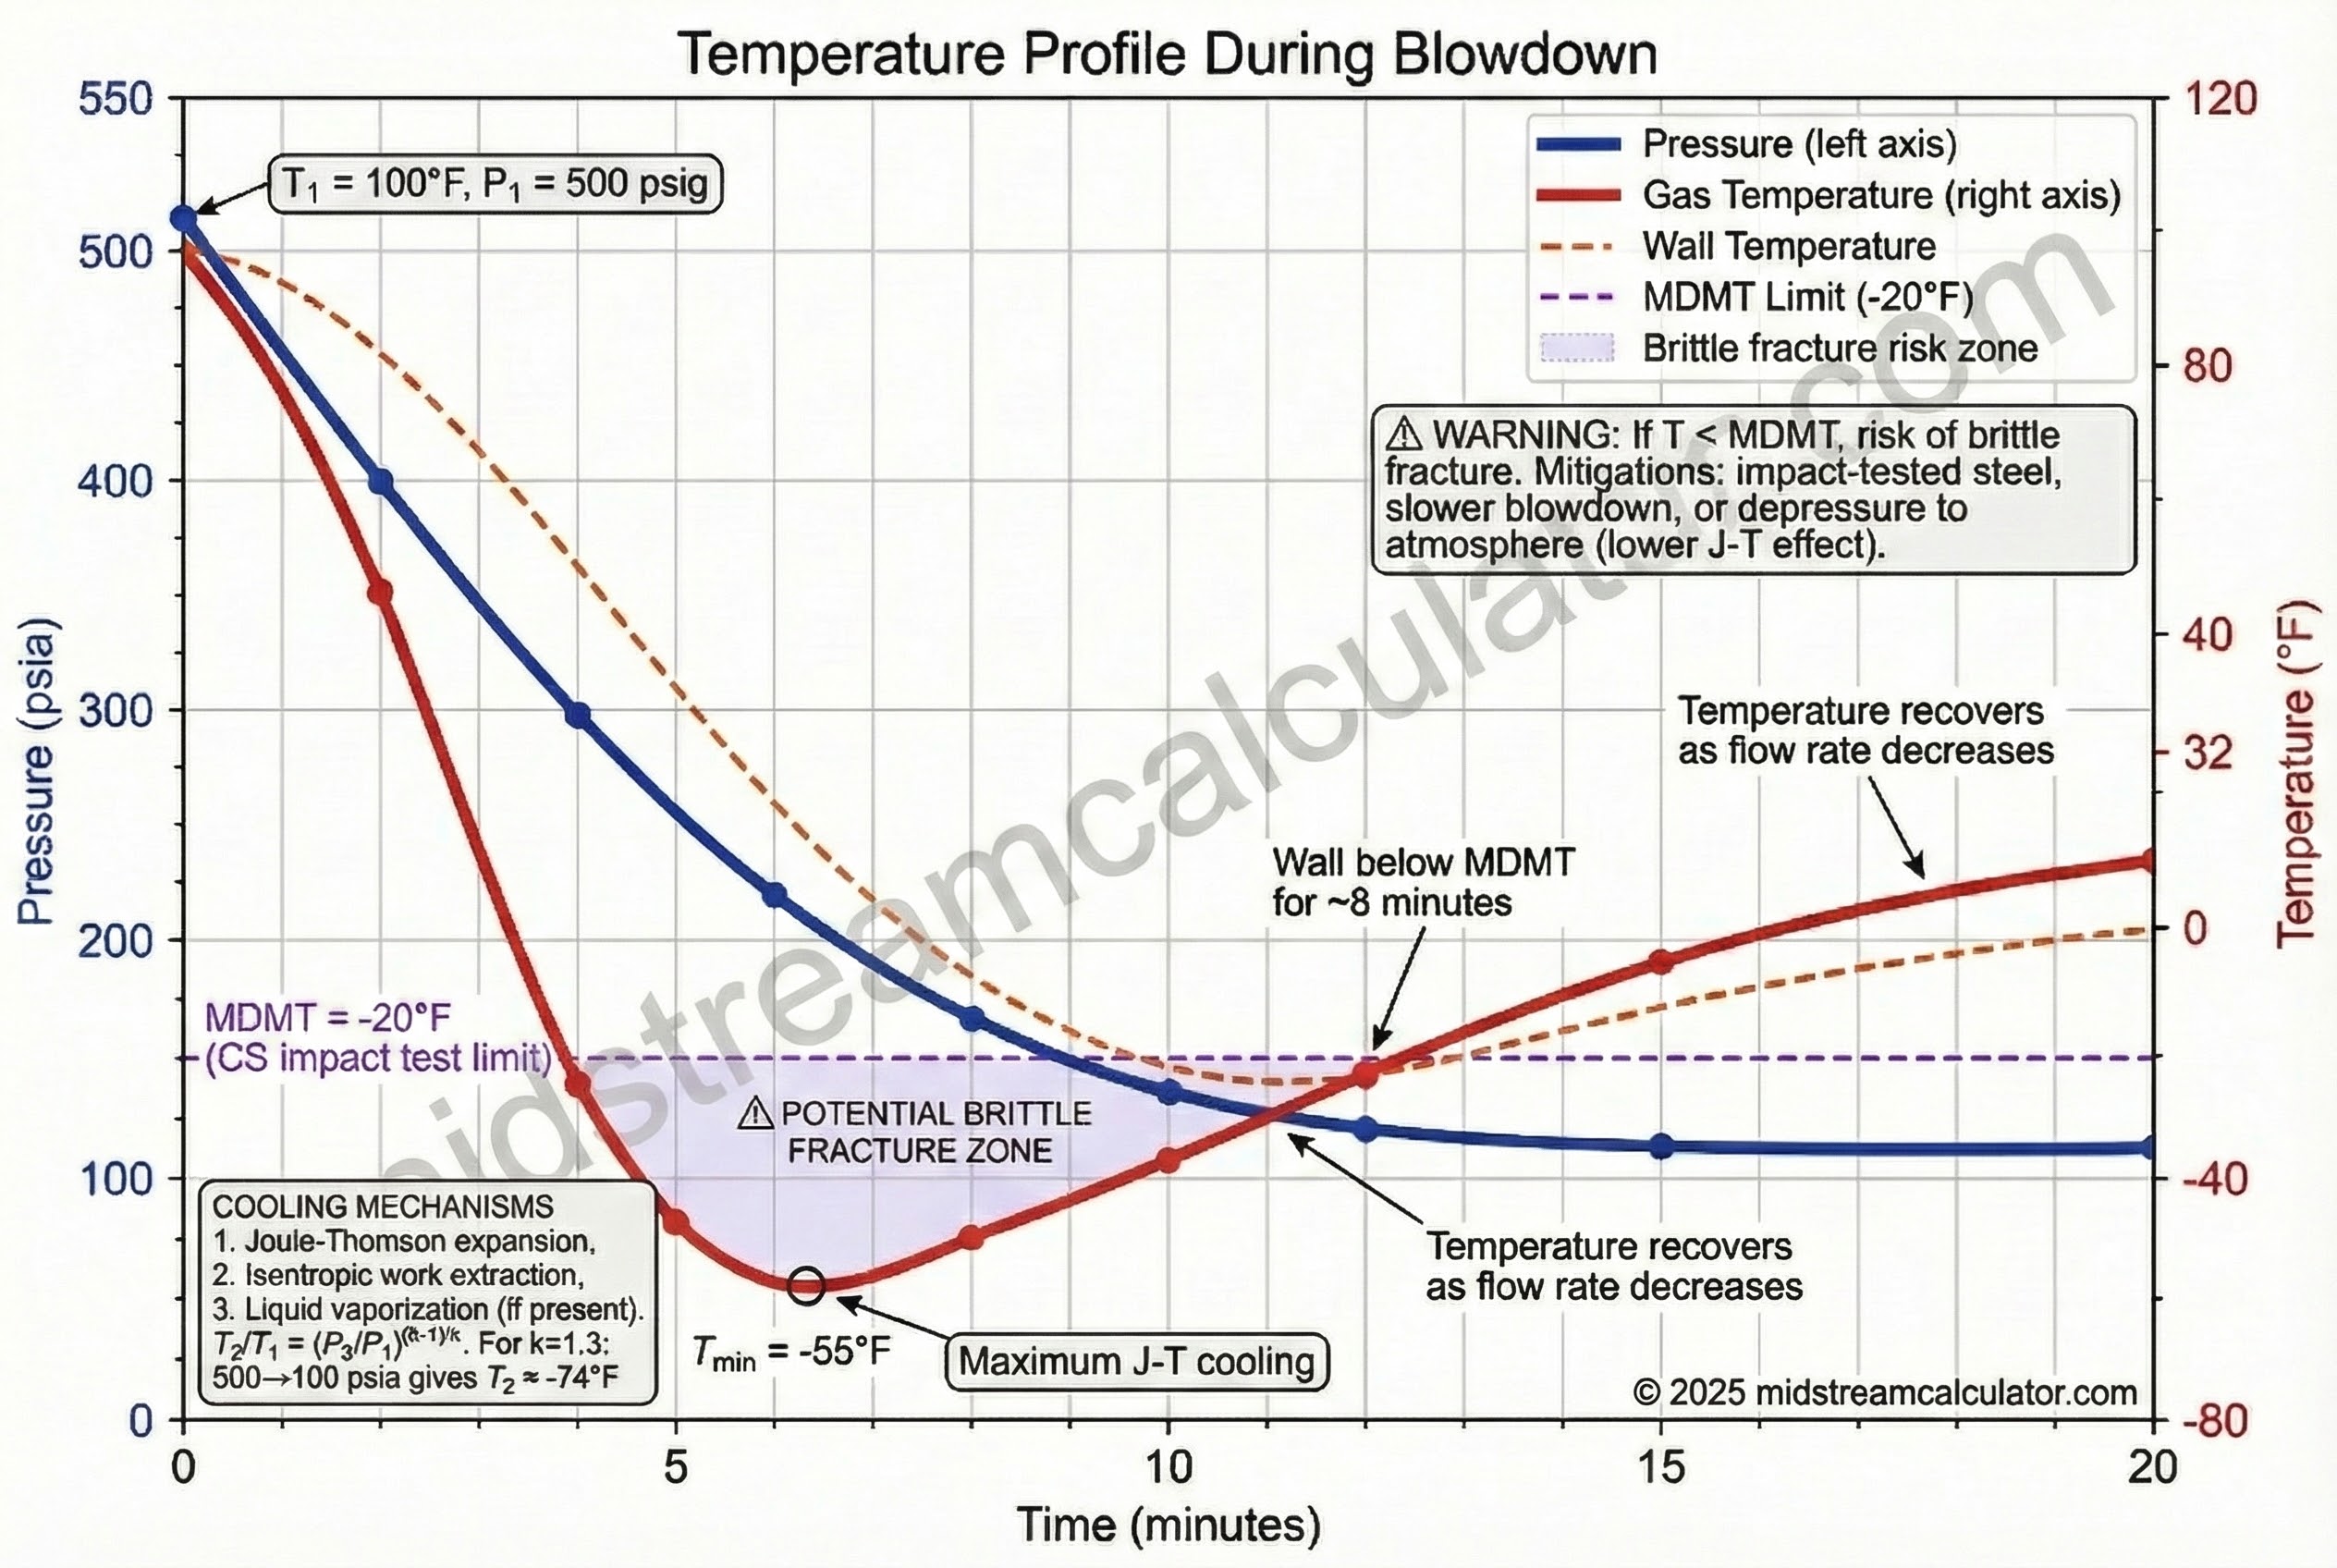
Mitigation Strategies
| Strategy | Application |
|---|---|
| Low-temp materials | Impact-tested steel, stainless, or nickel alloys |
| Controlled blowdown rate | Staged orifices or larger time target |
| Depressure to atmosphere | Reduces J-T effect vs. flare backpressure |
| Heat tracing | Blowdown piping to prevent ice plugging |
⚠ MDMT verification: Always calculate minimum metal temperature during blowdown. If below MDMT, upgrade materials or reduce blowdown rate. Brittle fracture is catastrophic.
5. System Design
Blowdown Valve Selection
- Type: Ball valve (full-bore, low ΔP) or globe valve (throttling)
- Actuator: Fail-open (spring-return) for fire case, or fail-closed with ESD override
- Speed: Fast opening (<5 seconds) for emergency
- SIL rating: Per risk assessment (typically SIL 2 for fire case)
Restriction Orifice
- Location: Downstream of BDV (protects valve from erosion)
- Type: Single-hole or multi-hole plate
- Material: Stainless or stellite for erosion resistance
- Sizing: Per blowdown calculation
Piping Layout
- Header sizing: Limit velocity to avoid noise/vibration (<0.5 Mach)
- Knockout drum: Capture any liquid carryover before flare
- Slope: Drain toward KO drum
- Supports: Design for thermal movement and reaction forces
References
- API 521 – Pressure-relieving and Depressuring Systems
- API 520 – Sizing, Selection, and Installation of PRDs
- API 537 – Flare Details for General Refinery and Petrochemical Service
- NORSOK S-001 – Technical Safety
- ISO 23251 – Petroleum and Natural Gas Industries—Pressure-relieving Systems
- Sutton, R.P. (1985) – Compressibility Factors for High-MW Reservoir Gases, SPE 14265
- GPSA
Ready to use the calculator?
→ Launch Calculator